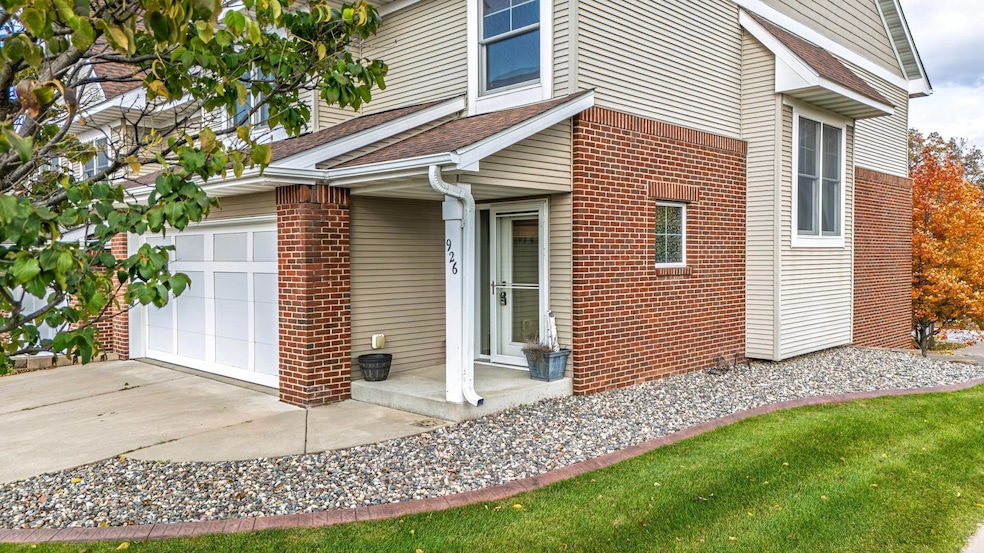
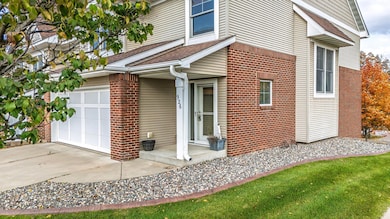
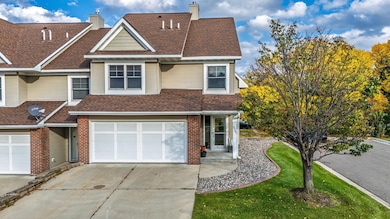
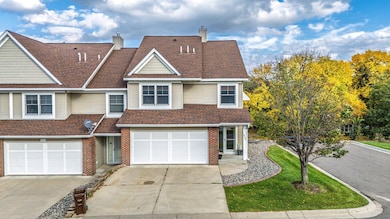
926 Ramsey St Hastings, MN 55033
Hastings-Marshan Township NeighborhoodHighlights
- Deck
- Loft
- Porch
- Kennedy Elementary School Rated A-
- No HOA
- 2 Car Attached Garage
About This Home
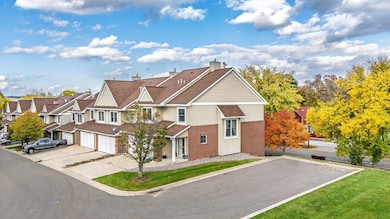
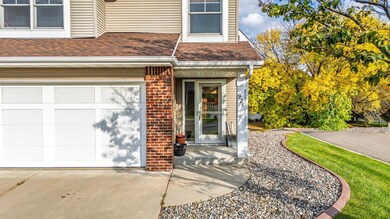
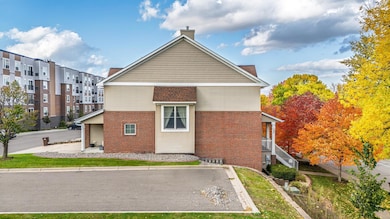
Beautifully situated just steps from downtown Hastings and the river, this spacious townhome offers the perfect blend of charm and modern comfort. The upper level features a luxurious primary suite with a 3⁄4 bath, two additional bedrooms, a full bath, and a versatile office loft. The open-concept main floor showcases a welcoming fireplace, expansive windows, and a stylish kitchen with a breakfast bar that flows into the dining area—all overlooking the deck and the picturesque historic street. The lower level offers a large family room with a bar area, abundant natural light, a fourth bathroom, and ample storage space. Enjoy historic charm, walkable convenience, and contemporary living—all in one exceptional home.
Showing agents and renters, please verify measurements.
Townhouse Details
Home Type
- Townhome
Est. Annual Taxes
- $3,722
Year Built
- Built in 2004
Lot Details
- Lot Dimensions are 36 x 81
- Sprinkler System
Parking
- 2 Car Attached Garage
Home Design
- Vinyl Siding
Interior Spaces
- 2-Story Property
- Gas Fireplace
- Entrance Foyer
- Family Room
- Living Room
- Combination Kitchen and Dining Room
- Loft
- Finished Basement
- Natural lighting in basement
Kitchen
- Range
- Microwave
- Dishwasher
Bedrooms and Bathrooms
- 3 Bedrooms
Laundry
- Laundry Room
- Dryer
- Washer
Outdoor Features
- Deck
- Porch
Utilities
- Forced Air Heating and Cooling System
- Cable TV Available
Community Details
- No Home Owners Association
- Schoolhouse Square Subdivision
Listing and Financial Details
- Property Available on 11/5/25
- Assessor Parcel Number 196690001010
Map
Source: NorthstarMLS
MLS Number: 6809473
APN: 19-66900-01-010
Disclaimer: Certain information contained herein is derived from information provided by parties other than Homes.com. All information provided is deemed reliable, but is not guaranteed to be accurate and should be independently verified.
![]() Based on information submitted to the MLS GRID. All data is obtained from various sources and may not have been verified by broker or MLS GRID. Supplied Open House Information is subject to change without notice. All information should be independently reviewed and verified for accuracy. Properties may or may not be listed by the office/agent presenting the information. Some IDX listings have been excluded from this website.
Based on information submitted to the MLS GRID. All data is obtained from various sources and may not have been verified by broker or MLS GRID. Supplied Open House Information is subject to change without notice. All information should be independently reviewed and verified for accuracy. Properties may or may not be listed by the office/agent presenting the information. Some IDX listings have been excluded from this website.
The Digital Millennium Copyright Act of 1998, 17 U.S.C. § 512 (the “DMCA”) provides recourse for copyright owners who believe that material appearing on the Internet infringes their rights under U.S. copyright law. If you believe in good faith that any content or material made available in connection with our website or services infringes your copyright, you (or your agent) may send us a notice requesting that the content or material be removed, or access to it blocked.
Notices must be sent in writing by email to DMCAnotice@MLSGrid.com.
The DMCA requires that your notice of alleged copyright infringement include the following information:
(1) description of the copyrighted work that is the subject of claimed infringement;
(2) description of the alleged infringing content and information sufficient to permit us to locate the content;
(3) contact information for you, including your address, telephone number and email address;
(4) a statement by you that you have a good faith belief that the content in the manner complained of is not authorized by the copyright owner, or its agent, or by the operation of any law;
(5) a statement by you, signed under penalty of perjury, that the information in the notification is accurate and that you have the authority to enforce the copyrights that are claimed to be infringed; and
(6) a physical or electronic signature of the copyright owner or a person authorized to act on the copyright owner’s behalf. Failure to include all of the above information may result in the delay of the processing of your complaint.
- 211 10th St E
- 517 7th St E
- 217 2nd St E Unit 9
- 412 3rd St E
- 551 18th St E
- 1908 Vermillion St
- 2112 Spring St Unit 2
- 122 State St Unit 5
- 561 Westview Dr
- 501 Westview Dr
- 2400 Voyageur Pkwy
- 950 31st St W
- 325 33rd St W
- 2457 Yellowstone Dr
- 2444 Yellowstone Dr
- 1306 Lincoln Ln Unit 1-3
- 74 Meggan Dr
- 76 Meggan Dr
- 921 Pearl St Unit 2
- 675 Laura St
