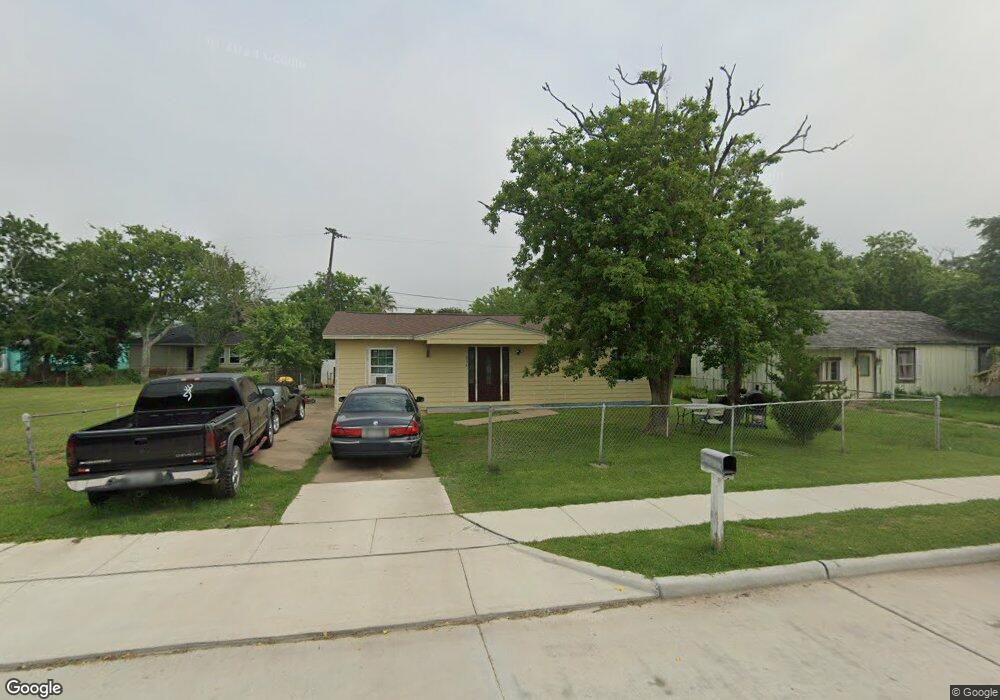
926 W 12th St Freeport, TX 77541
Estimated Value: $128,964 - $162,000
3
Beds
1
Bath
1,008
Sq Ft
$145/Sq Ft
Est. Value
About This Home
This home is located at 926 W 12th St, Freeport, TX 77541 and is currently estimated at $146,241, approximately $145 per square foot. 926 W 12th St is a home located in Brazoria County with nearby schools including O'Hara Lanier Middle School, Freeport Intermediate School, and Brazosport High School.
Ownership History
Date
Name
Owned For
Owner Type
Purchase Details
Closed on
Jul 13, 2001
Sold by
Guerra Rivera Arturo Allen and Guerra Rivera Elizabeth
Bought by
Monsivais Ramiro
Current Estimated Value
Purchase Details
Closed on
Jul 23, 1997
Sold by
Mckelvy Brent and Mckelvy Otilia C
Bought by
Estrada Martin and Estrada Eustacia
Purchase Details
Closed on
Jul 3, 1997
Sold by
Frazier Jerry L and Frazier Lisa
Bought by
Mckelvy Brent and Mckelvy Otilia C
Create a Home Valuation Report for This Property
The Home Valuation Report is an in-depth analysis detailing your home's value as well as a comparison with similar homes in the area
Home Values in the Area
Average Home Value in this Area
Purchase History
| Date | Buyer | Sale Price | Title Company |
|---|---|---|---|
| Monsivais Ramiro | $10,000 | -- | |
| Estrada Martin | -- | Texas American Title Company | |
| Mckelvy Brent | -- | -- |
Source: Public Records
Mortgage History
| Date | Status | Borrower | Loan Amount |
|---|---|---|---|
| Closed | Monsivais Ramiro | $0 |
Source: Public Records
Tax History Compared to Growth
Tax History
| Year | Tax Paid | Tax Assessment Tax Assessment Total Assessment is a certain percentage of the fair market value that is determined by local assessors to be the total taxable value of land and additions on the property. | Land | Improvement |
|---|---|---|---|---|
| 2025 | $885 | $105,149 | $20,130 | $105,520 |
| 2023 | $885 | $86,900 | $13,880 | $120,920 |
| 2022 | $1,951 | $79,000 | $4,580 | $112,660 |
| 2021 | $1,871 | $83,220 | $4,580 | $78,640 |
| 2020 | $1,732 | $79,470 | $4,580 | $74,890 |
| 2019 | $1,615 | $70,240 | $4,580 | $65,660 |
| 2018 | $1,478 | $53,710 | $4,580 | $49,130 |
| 2017 | $1,481 | $53,710 | $4,580 | $49,130 |
| 2016 | $1,481 | $53,710 | $4,580 | $49,130 |
| 2014 | $1,010 | $49,830 | $4,580 | $45,250 |
Source: Public Records
Map
Nearby Homes