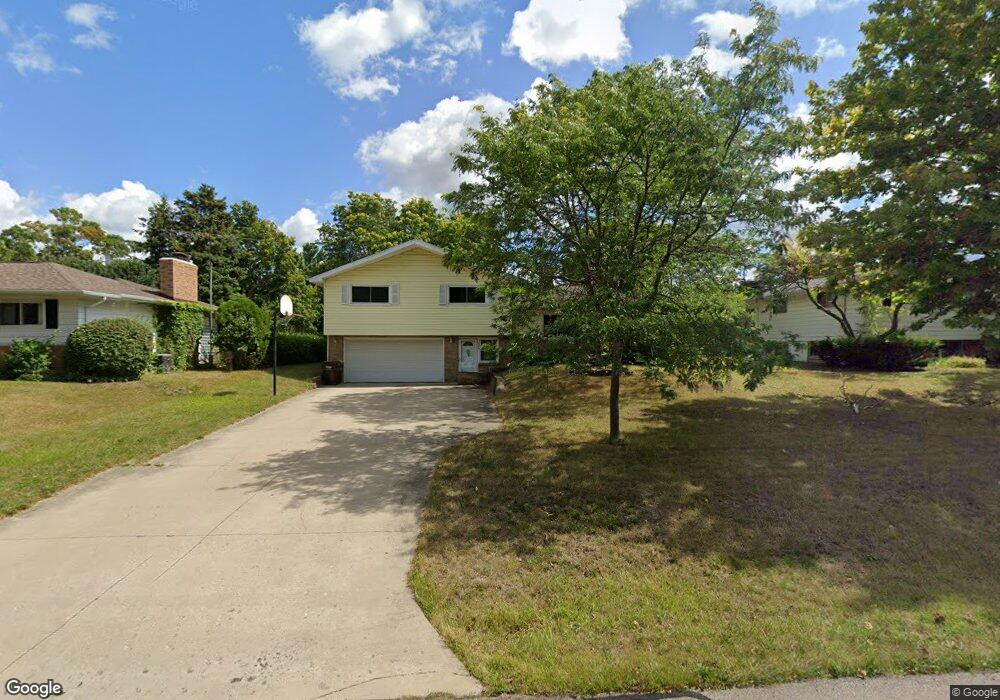
926 W Thomas L Pkwy Lansing, MI 48917
Estimated Value: $226,000 - $267,000
3
Beds
2
Baths
2,243
Sq Ft
$108/Sq Ft
Est. Value
About This Home
This home is located at 926 W Thomas L Pkwy, Lansing, MI 48917 and is currently estimated at $242,784, approximately $108 per square foot. 926 W Thomas L Pkwy is a home located in Eaton County with nearby schools including Waverly Senior High School, Windemere Park Charter Academy, and St. Gerard Elementary School.
Ownership History
Date
Name
Owned For
Owner Type
Purchase Details
Closed on
Dec 22, 2011
Sold by
Us Bank National Association
Bought by
Davis Keesha T
Current Estimated Value
Home Financials for this Owner
Home Financials are based on the most recent Mortgage that was taken out on this home.
Original Mortgage
$92,591
Outstanding Balance
$62,141
Interest Rate
3.62%
Mortgage Type
FHA
Estimated Equity
$180,643
Purchase Details
Closed on
Aug 11, 2011
Sold by
Us Bank National Association
Bought by
Us Bank National Association
Purchase Details
Closed on
Jan 13, 2011
Sold by
Freeman Vicky and Freeman Dion
Bought by
Us Bank National Association
Purchase Details
Closed on
Sep 27, 2004
Sold by
Adams Ward J and Adams Kimberly S
Bought by
Freeman Dion and Freeman Vicky
Home Financials for this Owner
Home Financials are based on the most recent Mortgage that was taken out on this home.
Original Mortgage
$165,900
Interest Rate
7.87%
Mortgage Type
Purchase Money Mortgage
Create a Home Valuation Report for This Property
The Home Valuation Report is an in-depth analysis detailing your home's value as well as a comparison with similar homes in the area
Home Values in the Area
Average Home Value in this Area
Purchase History
| Date | Buyer | Sale Price | Title Company |
|---|---|---|---|
| Davis Keesha T | $95,000 | Etitle Agency Inc | |
| Us Bank National Association | -- | E Title Agency | |
| Us Bank National Association | $93,500 | None Available | |
| Freeman Dion | $165,900 | Transnation |
Source: Public Records
Mortgage History
| Date | Status | Borrower | Loan Amount |
|---|---|---|---|
| Open | Davis Keesha T | $92,591 | |
| Previous Owner | Freeman Dion | $165,900 |
Source: Public Records
Tax History Compared to Growth
Tax History
| Year | Tax Paid | Tax Assessment Tax Assessment Total Assessment is a certain percentage of the fair market value that is determined by local assessors to be the total taxable value of land and additions on the property. | Land | Improvement |
|---|---|---|---|---|
| 2025 | $3,433 | $96,700 | $0 | $0 |
| 2024 | $2,029 | $92,200 | $0 | $0 |
| 2023 | $1,951 | $87,300 | $0 | $0 |
| 2022 | $2,989 | $82,200 | $0 | $0 |
| 2021 | $2,891 | $76,400 | $0 | $0 |
| 2020 | $3,008 | $71,100 | $0 | $0 |
| 2019 | $2,956 | $68,070 | $0 | $0 |
| 2018 | $2,907 | $66,800 | $0 | $0 |
| 2017 | $2,842 | $65,700 | $0 | $0 |
| 2016 | -- | $62,800 | $0 | $0 |
| 2015 | -- | $62,700 | $0 | $0 |
| 2014 | -- | $62,100 | $0 | $0 |
| 2013 | -- | $61,800 | $0 | $0 |
Source: Public Records
Map
Nearby Homes
- 4120 Arlene Dr
- 1222 Ravenswood Dr
- 531 Harriet Ave
- 0000 N Dibble Ave
- 1049 Maycroft Rd
- 3435 Hagan St
- 1920 Briarwood Dr
- 3333 W Willow St
- 1610 Ravenswood Dr
- 0 San Gabriel
- 3502 Springbrook Ln
- 3316 W Willow St
- 205 Renker Rd
- 3322 Pickwick Place
- 1031 Mall Dr E
- 1805 Boynton Dr
- 4320 Mar Moor Dr
- 215 Winifred Ave Unit A & B
- 4915 Canyon Trail
- 1516 Elmwood Rd
- 918 W Thomas L Pkwy
- 934 W Thomas L Pkwy
- 925 E Thomas L Pkwy
- 4113 Elizabeth Rd
- 917 E Thomas L Pkwy
- 910 W Thomas L Pkwy
- 921 W Thomas L Pkwy
- 937 E Thomas L Pkwy
- 909 E Thomas L Pkwy
- 933 W Thomas L Pkwy
- 915 W Thomas L Pkwy
- 904 W Thomas L Pkwy
- 941 W Thomas L Pkwy
- 907 W Thomas L Pkwy
- 903 E Thomas L Pkwy
- 1002 W Thomas L Pkwy
- 1005 W Thomas L Pkwy
- 868 W Thomas L Pkwy
- 932 E Thomas L Pkwy