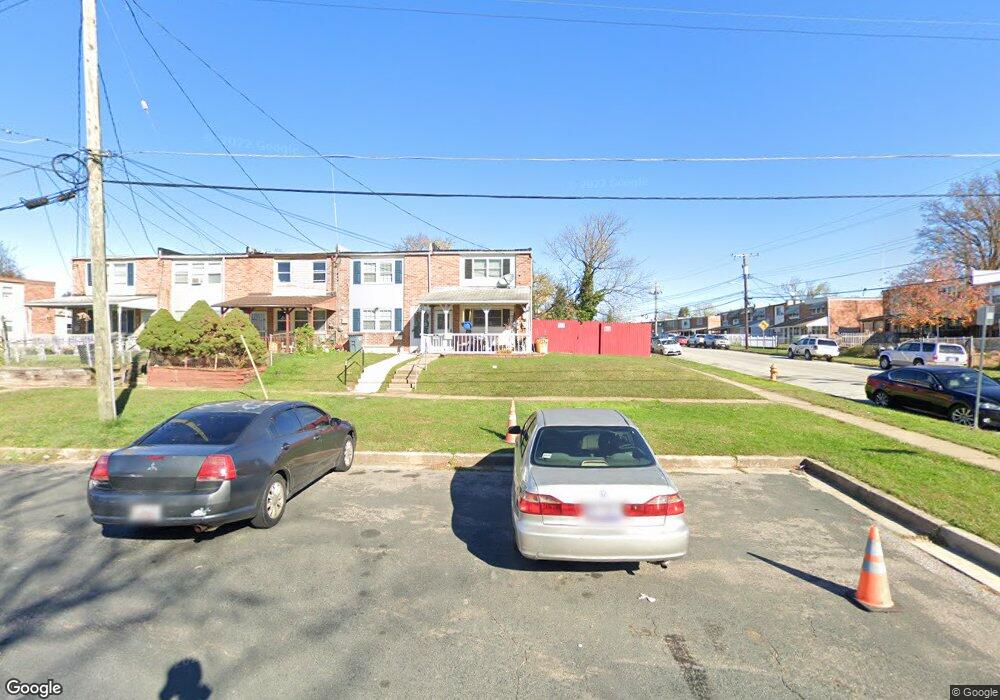
926 Winsap Ct Halethorpe, MD 21227
Lansdowne NeighborhoodEstimated Value: $162,510 - $189,000
3
Beds
1
Bath
1,024
Sq Ft
$175/Sq Ft
Est. Value
About This Home
This home is located at 926 Winsap Ct, Halethorpe, MD 21227 and is currently estimated at $179,128, approximately $174 per square foot. 926 Winsap Ct is a home located in Baltimore County with nearby schools including Riverview Elementary School, Lansdowne Middle School, and Lansdowne High School.
Ownership History
Date
Name
Owned For
Owner Type
Purchase Details
Closed on
Oct 6, 2009
Sold by
Stone Austin Craig
Bought by
Kelly Christina L
Current Estimated Value
Purchase Details
Closed on
Jul 31, 2002
Sold by
Stone Austin Craig
Bought by
Stone Austin Craig and Stone Patricia Ellen
Purchase Details
Closed on
Nov 12, 1991
Sold by
Johnson Douglas R
Bought by
Stone Austin Craig
Create a Home Valuation Report for This Property
The Home Valuation Report is an in-depth analysis detailing your home's value as well as a comparison with similar homes in the area
Home Values in the Area
Average Home Value in this Area
Purchase History
| Date | Buyer | Sale Price | Title Company |
|---|---|---|---|
| Kelly Christina L | $127,500 | -- | |
| Stone Austin Craig | -- | -- | |
| Stone Austin Craig | $67,900 | -- |
Source: Public Records
Tax History
| Year | Tax Paid | Tax Assessment Tax Assessment Total Assessment is a certain percentage of the fair market value that is determined by local assessors to be the total taxable value of land and additions on the property. | Land | Improvement |
|---|---|---|---|---|
| 2025 | $2,270 | $115,700 | -- | -- |
| 2024 | $2,270 | $105,500 | $37,400 | $68,100 |
| 2023 | $2,306 | $102,500 | $0 | $0 |
| 2022 | $1,856 | $99,500 | $0 | $0 |
| 2021 | $1,708 | $96,500 | $37,400 | $59,100 |
| 2020 | $1,708 | $94,467 | $0 | $0 |
| 2019 | $1,514 | $92,433 | $0 | $0 |
| 2018 | $1,618 | $90,400 | $37,400 | $53,000 |
| 2017 | $1,609 | $88,200 | $0 | $0 |
| 2016 | -- | $86,000 | $0 | $0 |
| 2015 | $2,003 | $83,800 | $0 | $0 |
| 2014 | $2,003 | $83,800 | $0 | $0 |
Source: Public Records
Map
Nearby Homes
- 4157 Hollins Ferry Rd
- 401 2nd Ave
- 413 1st Ave
- 418 1st Ave
- 3504 Shenandoah Ave
- 302 4th Ave
- 4438 Scotia Rd
- 4435 Scotia Rd
- 2812 Florida Ave
- 4415 Norfen Rd
- 2828 Alabama Ave
- 4323 Annapolis Rd
- 216 Clyde Ave
- 2773 Yarnall Rd
- 2818 Rose Ave
- 238 Elizabeth Ave
- 2911 Vermont Ave
- 2909 Louisiana Ave
- 3207 Janice Ave
- 0 Hammonds Ferry Rd
Your Personal Tour Guide
Ask me questions while you tour the home.