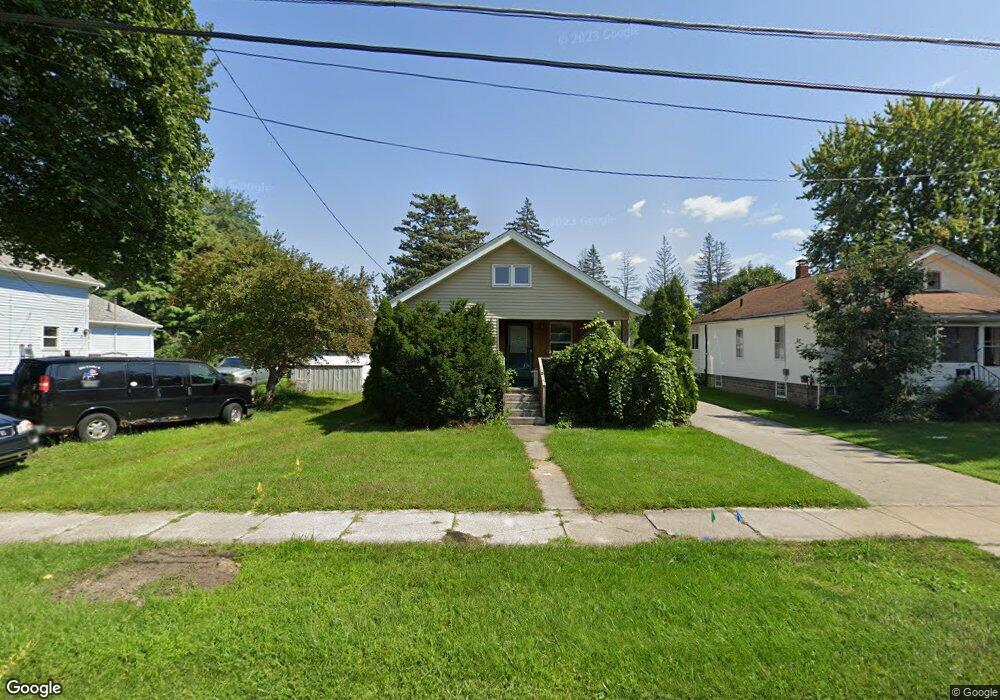
926 Wright St Saginaw, MI 48602
Estimated Value: $89,448 - $106,000
--
Bed
--
Bath
972
Sq Ft
$104/Sq Ft
Est. Value
About This Home
This home is located at 926 Wright St, Saginaw, MI 48602 and is currently estimated at $101,112, approximately $104 per square foot. 926 Wright St is a home located in Saginaw County with nearby schools including Chester F. Miller School, Thompson Middle School, and Arthur Hill High School.
Ownership History
Date
Name
Owned For
Owner Type
Purchase Details
Closed on
Nov 10, 2015
Sold by
Housing And Urban Development
Bought by
Ehline Kenneth R
Current Estimated Value
Purchase Details
Closed on
Oct 24, 2002
Sold by
Lesh Jason M
Bought by
Ohmer David R
Home Financials for this Owner
Home Financials are based on the most recent Mortgage that was taken out on this home.
Original Mortgage
$71,405
Interest Rate
6.22%
Mortgage Type
FHA
Purchase Details
Closed on
Feb 14, 2002
Sold by
First Union National Bank
Bought by
Lesh Jason M
Purchase Details
Closed on
Jun 7, 2001
Sold by
Haller Jennifer and Haller Richard
Bought by
First Union National Bank
Purchase Details
Closed on
Feb 24, 1997
Sold by
Jurek John J and Jurek Stacy
Bought by
Haller Jennifer and Haller Richard
Purchase Details
Closed on
Nov 23, 1988
Sold by
Wedding Frederick J and Wedding Cynthia J
Bought by
Jurek John J
Purchase Details
Closed on
May 16, 1979
Sold by
Kross Catherine M
Bought by
Wedding Frederick J and Wedding Cynthia J
Create a Home Valuation Report for This Property
The Home Valuation Report is an in-depth analysis detailing your home's value as well as a comparison with similar homes in the area
Home Values in the Area
Average Home Value in this Area
Purchase History
| Date | Buyer | Sale Price | Title Company |
|---|---|---|---|
| Ehline Kenneth R | $12,500 | -- | |
| Ohmer David R | $72,000 | -- | |
| Ohmer David R | $72,000 | Metropolitan Title Company | |
| Lesh Jason M | $44,500 | -- | |
| First Union National Bank | $91,700 | -- | |
| Haller Jennifer | $47,600 | -- | |
| Jurek John J | $26,000 | -- | |
| Wedding Frederick J | $32,000 | -- |
Source: Public Records
Mortgage History
| Date | Status | Borrower | Loan Amount |
|---|---|---|---|
| Previous Owner | Ohmer David R | $71,405 |
Source: Public Records
Tax History Compared to Growth
Tax History
| Year | Tax Paid | Tax Assessment Tax Assessment Total Assessment is a certain percentage of the fair market value that is determined by local assessors to be the total taxable value of land and additions on the property. | Land | Improvement |
|---|---|---|---|---|
| 2025 | $1,425 | $40,400 | $0 | $0 |
| 2024 | $1,082 | $37,100 | $0 | $0 |
| 2023 | $1,306 | $33,900 | $0 | $0 |
| 2022 | $1,565 | $28,300 | $0 | $0 |
| 2021 | $1,465 | $24,500 | $0 | $0 |
| 2020 | $1,299 | $23,100 | $0 | $0 |
| 2019 | $1,256 | $20,500 | $2,700 | $17,800 |
| 2018 | $996 | $20,978 | $0 | $0 |
| 2017 | $1,186 | $20,800 | $0 | $0 |
| 2016 | $1,157 | $20,733 | $0 | $0 |
| 2014 | -- | $21,198 | $0 | $18,339 |
| 2013 | -- | $21,302 | $0 | $0 |
Source: Public Records
Map
Nearby Homes
- 1111 Wright St
- 807 Thurman St
- 714 Yale St
- 1404 Birney St
- 1515 Beech St
- 254 Lockwood St
- 643 Thurman St
- 251 Trier St
- 1403 Cypress St
- 2517 Mackinaw St
- 1617 Van Buren St
- 1930 Brockway St
- 222 Borland Ct
- 713 S Woodbridge St
- 1737 Newberry St
- 1402 Mackinaw St
- 310 S Bates St
- 2025 Carman Dr
- 1323 Mackinaw St
- 1717 Ottawa St