
Seller's Agent in 2025
Beth Petersen Randall
eXp Realty
(612) 865-2840
6 in this area
165 Total Sales
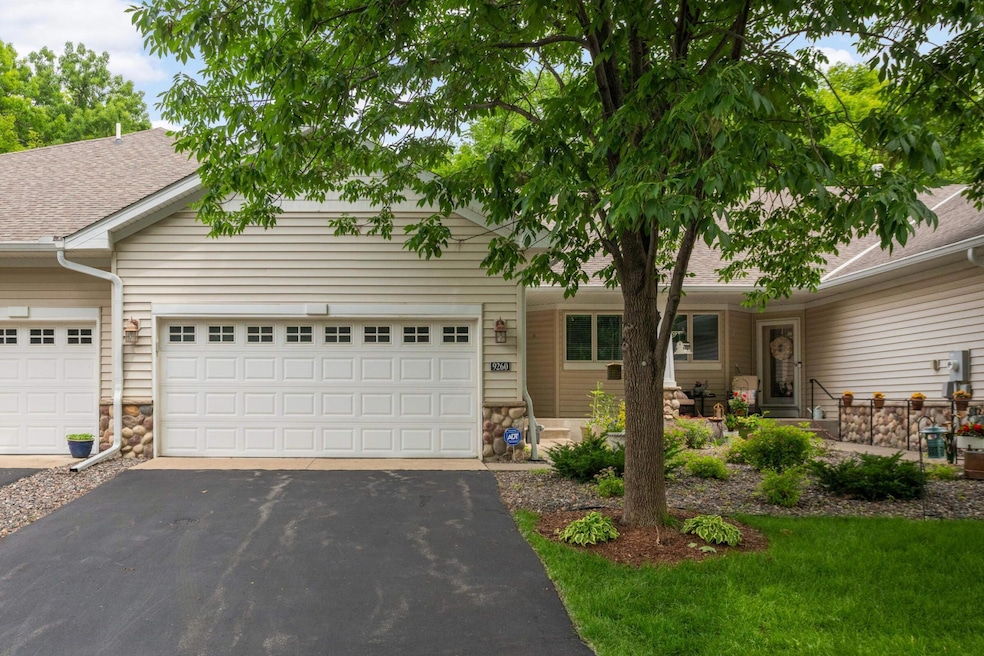

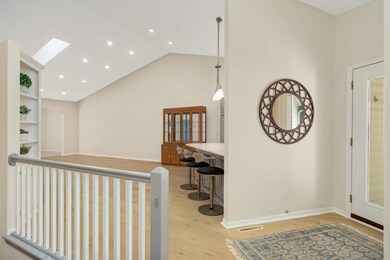
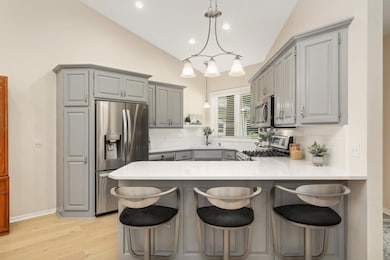
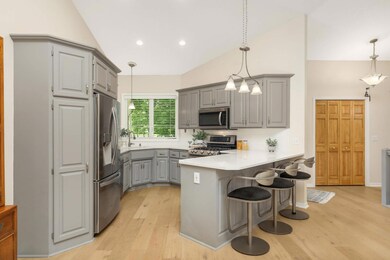
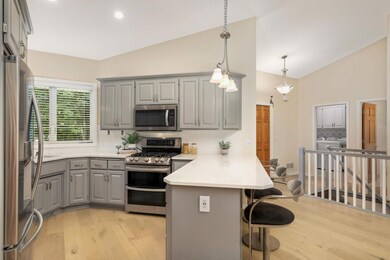

Welcome to easy one-level living in the heart of Maple Grove! This thoughtfully designed townhome offers all main-floor essentials: a spacious living room, sunroom, and dining area, plus built-ins and a cozy gas fireplace. The updated kitchen overlooks the front of the home and features enameled cabinets, quartz counters, a stylish backsplash, stainless steel appliances, gas range, and Bosch dishwasher. The large primary suite includes a walk-in closet, double vanity, soaker tub, and separate shower. Enjoy main-floor laundry and the ease of daily living without stairs. Downstairs, you'll find an expansive amusement room with another fireplace, a 2nd bedroom, 3⁄4 bath, office, and tons of storage plus updated mechanicals and all new carpet throughout. Relax on your private back deck with wooded views or sip coffee on the charming front porch. Just steps from parks, trails, shopping, dining, and your daily Starbucks run. Quick access to highways makes commuting a breeze. Welcome home!
Last Agent to Sell the Property
eXp Realty Brokerage Phone: 612-865-2840 Listed on: 08/04/2025
| Date | Type | Sale Price | Title Company |
|---|---|---|---|
| Warranty Deed | $325,000 | Edina Realty Title Inc | |
| Interfamily Deed Transfer | -- | None Available | |
| Foreclosure Deed | $214,000 | -- | |
| Warranty Deed | $274,634 | -- |
| Date | Status | Loan Amount | Loan Type |
|---|---|---|---|
| Open | $125,000 | New Conventional |
| Date | Event | Price | List to Sale | Price per Sq Ft |
|---|---|---|---|---|
| 11/07/2025 11/07/25 | Sold | $360,000 | 0.0% | $159 / Sq Ft |
| 10/31/2025 10/31/25 | Pending | -- | -- | -- |
| 09/25/2025 09/25/25 | For Sale | $360,000 | 0.0% | $159 / Sq Ft |
| 08/30/2025 08/30/25 | Pending | -- | -- | -- |
| 08/14/2025 08/14/25 | Price Changed | $360,000 | -5.3% | $159 / Sq Ft |
| 08/04/2025 08/04/25 | For Sale | $380,000 | -- | $168 / Sq Ft |
| Year | Tax Paid | Tax Assessment Tax Assessment Total Assessment is a certain percentage of the fair market value that is determined by local assessors to be the total taxable value of land and additions on the property. | Land | Improvement |
|---|---|---|---|---|
| 2024 | $5,044 | $401,800 | $37,200 | $364,600 |
| 2023 | $4,735 | $383,800 | $40,000 | $343,800 |
| 2022 | $4,192 | $397,200 | $34,000 | $363,200 |
| 2021 | $4,425 | $330,300 | $31,300 | $299,000 |
| 2020 | $4,394 | $342,800 | $31,300 | $311,500 |
| 2019 | $4,184 | $343,200 | $45,500 | $297,700 |
| 2018 | $4,067 | $311,200 | $27,500 | $283,700 |
| 2017 | $4,131 | $291,000 | $43,000 | $248,000 |
| 2016 | $3,896 | $272,600 | $50,000 | $222,600 |
| 2015 | $3,838 | $262,300 | $36,000 | $226,300 |
| 2014 | -- | $244,700 | $57,000 | $187,700 |
Seller's Agent in 2025
Beth Petersen Randall
eXp Realty
(612) 865-2840
6 in this area
165 Total Sales
Buyer's Agent in 2025
Karen Collins
Keller Williams Integrity Realty
(651) 492-3473
5 in this area
87 Total Sales
Source: NorthstarMLS
MLS Number: 6766853
APN: 17-119-22-12-0159
Disclaimer: Certain information contained herein is derived from information provided by parties other than Homes.com. All information provided is deemed reliable, but is not guaranteed to be accurate and should be independently verified.
![]() Based on information submitted to the MLS GRID. All data is obtained from various sources and may not have been verified by broker or MLS GRID. Supplied Open House Information is subject to change without notice. All information should be independently reviewed and verified for accuracy. Properties may or may not be listed by the office/agent presenting the information. Some IDX listings have been excluded from this website.
Based on information submitted to the MLS GRID. All data is obtained from various sources and may not have been verified by broker or MLS GRID. Supplied Open House Information is subject to change without notice. All information should be independently reviewed and verified for accuracy. Properties may or may not be listed by the office/agent presenting the information. Some IDX listings have been excluded from this website.
The Digital Millennium Copyright Act of 1998, 17 U.S.C. § 512 (the “DMCA”) provides recourse for copyright owners who believe that material appearing on the Internet infringes their rights under U.S. copyright law. If you believe in good faith that any content or material made available in connection with our website or services infringes your copyright, you (or your agent) may send us a notice requesting that the content or material be removed, or access to it blocked.
Notices must be sent in writing by email to DMCAnotice@MLSGrid.com.
The DMCA requires that your notice of alleged copyright infringement include the following information:
(1) description of the copyrighted work that is the subject of claimed infringement;
(2) description of the alleged infringing content and information sufficient to permit us to locate the content;
(3) contact information for you, including your address, telephone number and email address;
(4) a statement by you that you have a good faith belief that the content in the manner complained of is not authorized by the copyright owner, or its agent, or by the operation of any law;
(5) a statement by you, signed under penalty of perjury, that the information in the notification is accurate and that you have the authority to enforce the copyrights that are claimed to be infringed; and
(6) a physical or electronic signature of the copyright owner or a person authorized to act on the copyright owner’s behalf. Failure to include all of the above information may result in the delay of the processing of your complaint.