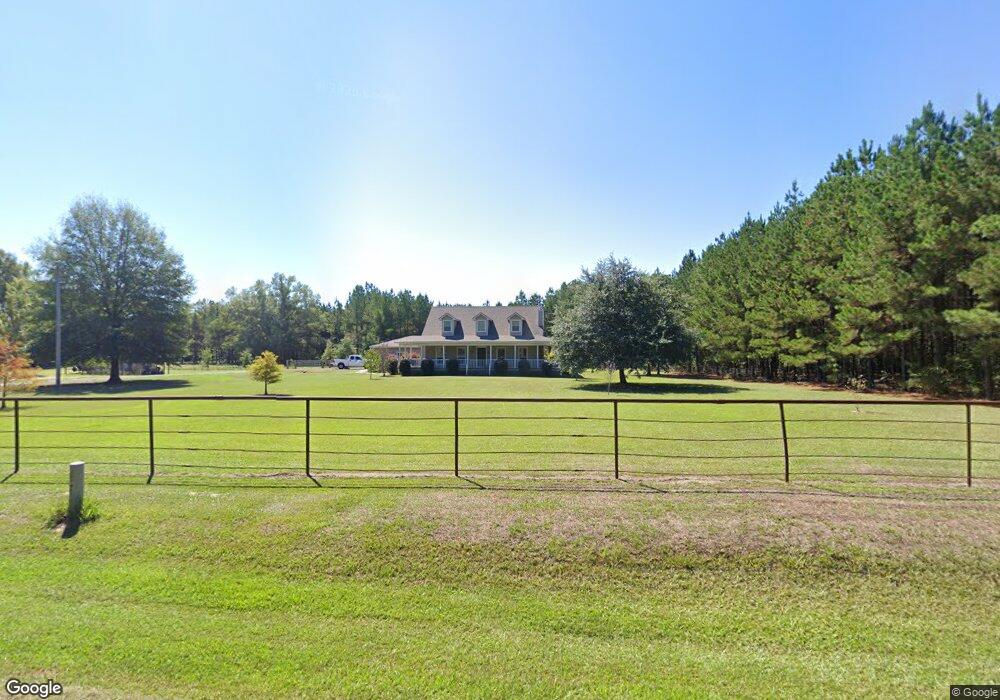
927 Dallas 209 Sparkman, AR 71763
Estimated Value: $223,000 - $433,482
4
Beds
2
Baths
2,690
Sq Ft
$122/Sq Ft
Est. Value
About This Home
This home is located at 927 Dallas 209, Sparkman, AR 71763 and is currently estimated at $329,121, approximately $122 per square foot. 927 Dallas 209 is a home located in Dallas County with nearby schools including Harmony Grove Elementary School, Sparkman K-12 School, and Sparkman Elementary School.
Ownership History
Date
Name
Owned For
Owner Type
Purchase Details
Closed on
Sep 26, 2019
Sold by
Baker M Brady
Bought by
Marlar William Braldey and Marlar Cheyla Ann
Current Estimated Value
Purchase Details
Closed on
May 15, 2019
Sold by
Baker Shara
Bought by
Baker M Brady
Purchase Details
Closed on
Sep 29, 2008
Sold by
Love John C and Love Sharon V
Bought by
Baker Matthew Brady and Baker Shara E
Home Financials for this Owner
Home Financials are based on the most recent Mortgage that was taken out on this home.
Original Mortgage
$237,650
Interest Rate
6.46%
Mortgage Type
Purchase Money Mortgage
Create a Home Valuation Report for This Property
The Home Valuation Report is an in-depth analysis detailing your home's value as well as a comparison with similar homes in the area
Home Values in the Area
Average Home Value in this Area
Purchase History
| Date | Buyer | Sale Price | Title Company |
|---|---|---|---|
| Marlar William Braldey | $229,000 | First National Title Company | |
| Baker M Brady | -- | None Available | |
| Baker Matthew Brady | $245,000 | None Available |
Source: Public Records
Mortgage History
| Date | Status | Borrower | Loan Amount |
|---|---|---|---|
| Previous Owner | Baker Matthew Brady | $237,650 |
Source: Public Records
Tax History Compared to Growth
Tax History
| Year | Tax Paid | Tax Assessment Tax Assessment Total Assessment is a certain percentage of the fair market value that is determined by local assessors to be the total taxable value of land and additions on the property. | Land | Improvement |
|---|---|---|---|---|
| 2025 | $1,601 | $48,840 | $2,240 | $46,600 |
| 2024 | $1,601 | $48,840 | $2,240 | $46,600 |
| 2023 | $1,546 | $28,580 | $2,600 | $25,980 |
| 2022 | $1,206 | $28,580 | $2,600 | $25,980 |
| 2021 | $1,206 | $28,580 | $2,600 | $25,980 |
| 2020 | $1,115 | $26,890 | $2,600 | $24,290 |
| 2019 | $1,106 | $26,890 | $2,600 | $24,290 |
| 2018 | $1,375 | $25,420 | $1,760 | $23,660 |
| 2017 | $1,060 | $25,420 | $1,760 | $23,660 |
| 2016 | $1,060 | $25,420 | $1,760 | $23,660 |
| 2015 | -- | $25,420 | $1,760 | $23,660 |
| 2014 | -- | $25,420 | $1,760 | $23,660 |
| 2013 | -- | $28,990 | $1,670 | $27,320 |
Source: Public Records
Map
Nearby Homes
- 0 Dallas 236
- 1 W Dallas County Line 20
- 1 W Dallas County Line
- 2327 Hwy 7n
- 1 Palmetto Rd
- 1 Atchley Cemetary Rd
- 1400 Hwy 7 Highway 7
- 0 Sparkman East 25 Unit 24032582
- 115 S Kelley St
- 000 Dallas 246
- 000 Dallas 273
- 0 White Oak Slough Rd
- 000 White Oak Slough Rd
- 0000 White Oak Dr
- 2178 Highway 128
- 2730 Arkansas 7
- 0000 Highway 8
- TBD Church Dr
- XXX W Woods Rd
- 244 Church Dr