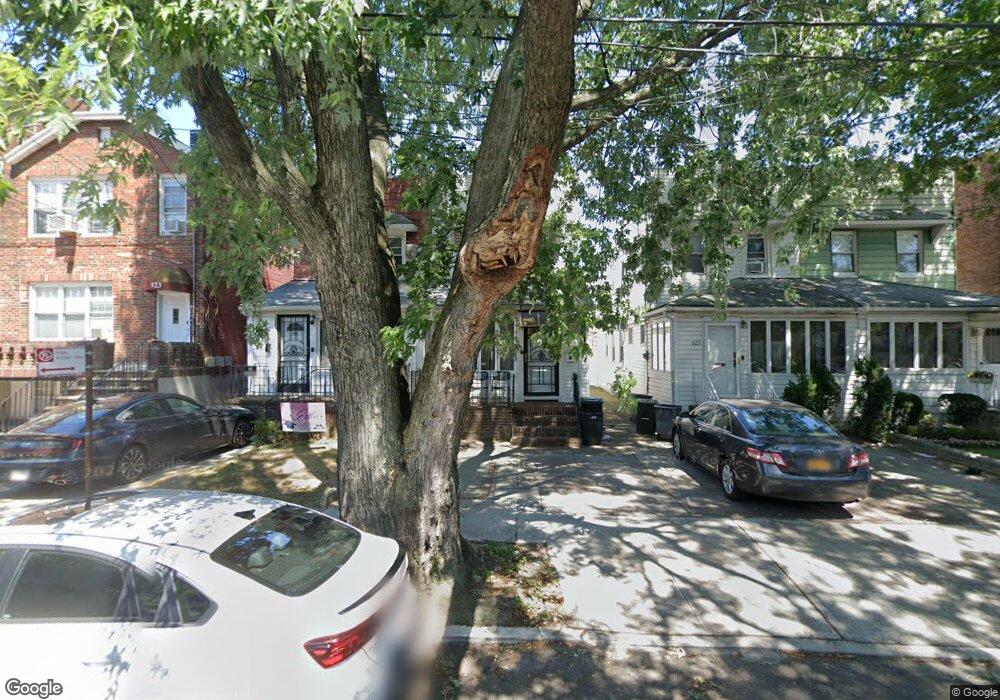
927 E 29th St Brooklyn, NY 11210
Midwood NeighborhoodEstimated Value: $889,000 - $1,068,000
Studio
--
Bath
1,440
Sq Ft
$695/Sq Ft
Est. Value
About This Home
This home is located at 927 E 29th St, Brooklyn, NY 11210 and is currently estimated at $1,001,013, approximately $695 per square foot. 927 E 29th St is a home located in Kings County with nearby schools including P.S. 193 Gil Hodges, Andries Hudde School, and Masores Bais Yaakov.
Ownership History
Date
Name
Owned For
Owner Type
Purchase Details
Closed on
Mar 21, 2013
Sold by
King David
Bought by
Hurewitz Elisa S and Hurewitz Eugene A
Current Estimated Value
Home Financials for this Owner
Home Financials are based on the most recent Mortgage that was taken out on this home.
Original Mortgage
$240,000
Outstanding Balance
$169,438
Interest Rate
3.55%
Mortgage Type
Commercial
Estimated Equity
$831,575
Purchase Details
Closed on
Mar 13, 2001
Sold by
Alberg Tamar
Bought by
King David and Guttmann Natalie
Home Financials for this Owner
Home Financials are based on the most recent Mortgage that was taken out on this home.
Original Mortgage
$200,000
Interest Rate
7.08%
Purchase Details
Closed on
Dec 4, 1997
Sold by
Baloota Inc
Bought by
Alberg Tamar Elberg
Home Financials for this Owner
Home Financials are based on the most recent Mortgage that was taken out on this home.
Original Mortgage
$176,000
Interest Rate
6.85%
Purchase Details
Closed on
May 6, 1997
Sold by
Malerba Vincent
Bought by
Baloota Inc
Create a Home Valuation Report for This Property
The Home Valuation Report is an in-depth analysis detailing your home's value as well as a comparison with similar homes in the area
Home Values in the Area
Average Home Value in this Area
Purchase History
| Date | Buyer | Sale Price | Title Company |
|---|---|---|---|
| Hurewitz Elisa S | $590,000 | -- | |
| King David | -- | -- | |
| Alberg Tamar Elberg | $220,000 | -- | |
| Baloota Inc | $82,500 | Commonwealth Land Title Ins |
Source: Public Records
Mortgage History
| Date | Status | Borrower | Loan Amount |
|---|---|---|---|
| Open | Hurewitz Elisa S | $240,000 | |
| Previous Owner | King David | $200,000 | |
| Previous Owner | Alberg Tamar Elberg | $176,000 |
Source: Public Records
Tax History
| Year | Tax Paid | Tax Assessment Tax Assessment Total Assessment is a certain percentage of the fair market value that is determined by local assessors to be the total taxable value of land and additions on the property. | Land | Improvement |
|---|---|---|---|---|
| 2025 | $9,197 | $52,920 | $17,880 | $35,040 |
| 2024 | $9,197 | $49,680 | $17,880 | $31,800 |
| 2023 | $8,774 | $51,060 | $17,880 | $33,180 |
| 2022 | $8,469 | $53,160 | $17,880 | $35,280 |
| 2021 | $8,633 | $41,580 | $17,880 | $23,700 |
| 2020 | $4,049 | $40,740 | $17,880 | $22,860 |
| 2019 | $7,983 | $40,740 | $17,880 | $22,860 |
| 2016 | $7,067 | $35,352 | $14,122 | $21,230 |
| 2015 | $3,803 | $33,708 | $19,270 | $14,438 |
| 2014 | $3,803 | $31,800 | $17,602 | $14,198 |
Source: Public Records
Map
Nearby Homes
- 909 E 29th St Unit 2E
- 909 E 29th St Unit 3F
- 909 E 29th St Unit 3D
- 1006 E 31st St
- 928 E 26th St
- 961 E 32nd St
- 945 E 32nd St
- 973 E 32nd St
- 3098 Bedford Ave
- 1804 New York Ave
- 2415 Avenue J
- 1533 - 1535 New York Ave
- 3199 Bedford Ave
- 1708 Flatbush Ave
- 1040 E 24th St
- 3402 Avenue J
- 881 E 23rd St
- 1742 Flatbush Ave
- 3412 Avenue J
- 1117 E 31st St
Your Personal Tour Guide
Ask me questions while you tour the home.