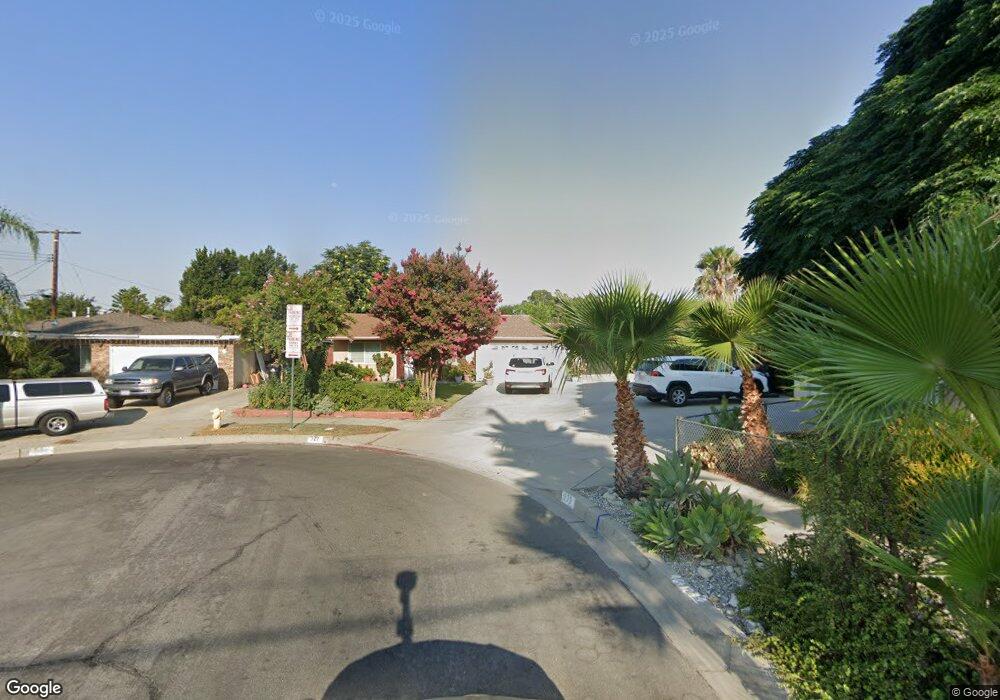
927 E F St Ontario, CA 91764
Estimated Value: $565,958 - $615,000
2
Beds
1
Bath
884
Sq Ft
$661/Sq Ft
Est. Value
About This Home
This home is located at 927 E F St, Ontario, CA 91764 and is currently estimated at $584,740, approximately $661 per square foot. 927 E F St is a home located in San Bernardino County with nearby schools including Lincoln Elementary School, Ray Wiltsey Middle School, and Chaffey High School.
Ownership History
Date
Name
Owned For
Owner Type
Purchase Details
Closed on
Apr 22, 2019
Sold by
Ruiz Elias Martinez and Martinez Maria R
Bought by
Ma Elias Martinez Ruiz and Ma Maria Cortez De
Current Estimated Value
Purchase Details
Closed on
Dec 30, 2003
Sold by
Martinez Elias
Bought by
Martinez Elias R and Martinez Maria C
Purchase Details
Closed on
Nov 29, 2001
Sold by
Martinez Elias and Martinez Maria
Bought by
Martinez Elias
Home Financials for this Owner
Home Financials are based on the most recent Mortgage that was taken out on this home.
Original Mortgage
$115,500
Interest Rate
7.17%
Create a Home Valuation Report for This Property
The Home Valuation Report is an in-depth analysis detailing your home's value as well as a comparison with similar homes in the area
Purchase History
| Date | Buyer | Sale Price | Title Company |
|---|---|---|---|
| Ma Elias Martinez Ruiz | -- | None Available | |
| Martinez Elias R | -- | -- | |
| Martinez Elias | -- | Landsafe Title |
Source: Public Records
Mortgage History
| Date | Status | Borrower | Loan Amount |
|---|---|---|---|
| Closed | Martinez Elias | $115,500 |
Source: Public Records
Tax History
| Year | Tax Paid | Tax Assessment Tax Assessment Total Assessment is a certain percentage of the fair market value that is determined by local assessors to be the total taxable value of land and additions on the property. | Land | Improvement |
|---|---|---|---|---|
| 2025 | $2,367 | $221,047 | $88,419 | $132,628 |
| 2024 | $2,312 | $216,712 | $86,685 | $130,027 |
| 2023 | $2,245 | $212,462 | $84,985 | $127,477 |
| 2022 | $2,214 | $208,296 | $83,319 | $124,977 |
| 2021 | $2,199 | $204,211 | $81,685 | $122,526 |
| 2020 | $2,159 | $202,117 | $80,847 | $121,270 |
| 2019 | $2,140 | $198,154 | $79,262 | $118,892 |
| 2018 | $2,108 | $194,269 | $77,708 | $116,561 |
| 2017 | $2,032 | $190,459 | $76,184 | $114,275 |
| 2016 | $1,950 | $186,724 | $74,690 | $112,034 |
| 2015 | $1,936 | $183,919 | $73,568 | $110,351 |
| 2014 | $1,874 | $180,316 | $72,127 | $108,189 |
Source: Public Records
Map
Nearby Homes
Your Personal Tour Guide
Ask me questions while you tour the home.