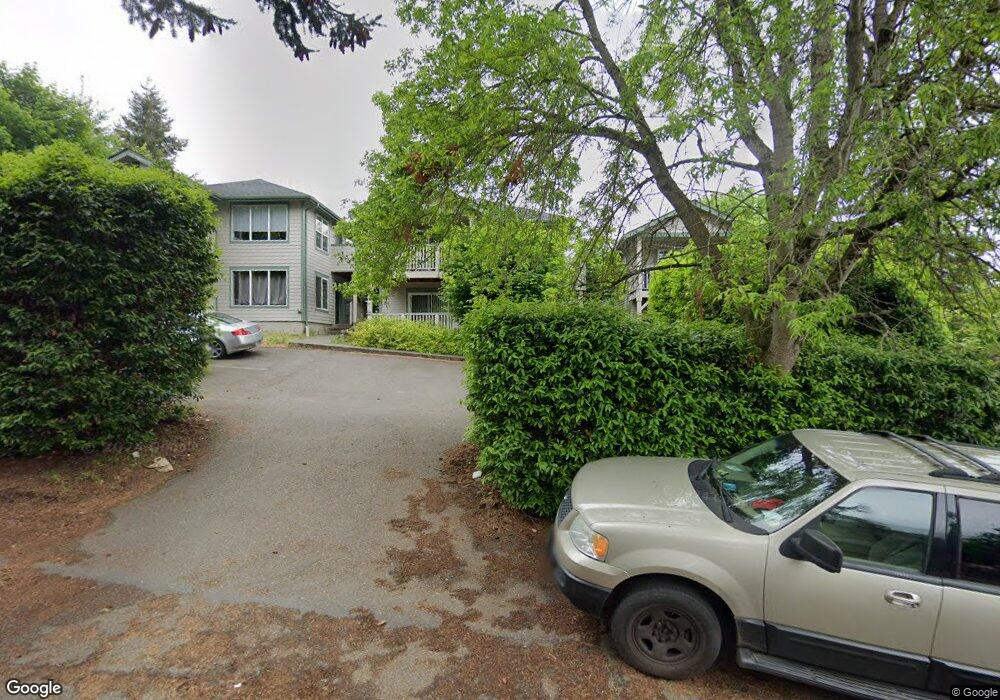
927 Otis St Unit 1B Bellingham, WA 98225
Sehome NeighborhoodEstimated Value: $323,000 - $392,000
3
Beds
2
Baths
1,005
Sq Ft
$365/Sq Ft
Est. Value
About This Home
This home is located at 927 Otis St Unit 1B, Bellingham, WA 98225 and is currently estimated at $366,587, approximately $364 per square foot. 927 Otis St Unit 1B is a home located in Whatcom County with nearby schools including Happy Valley Elementary School, Fairhaven Middle School, and Sehome High School.
Ownership History
Date
Name
Owned For
Owner Type
Purchase Details
Closed on
Jan 23, 2017
Sold by
Klineburger Jan L
Bought by
Chen Daniel and Chen Betty
Current Estimated Value
Purchase Details
Closed on
Sep 13, 2007
Sold by
927 Otis Llc
Bought by
Klineburger Jan L
Home Financials for this Owner
Home Financials are based on the most recent Mortgage that was taken out on this home.
Original Mortgage
$145,125
Interest Rate
6.67%
Mortgage Type
Purchase Money Mortgage
Purchase Details
Closed on
Mar 28, 2002
Sold by
Dempsey Deborah D
Bought by
927 Otis Llc
Purchase Details
Closed on
Dec 4, 2001
Sold by
Brisbane Wayne G and Brisbane Marilyn A
Bought by
Dempsey Deborah D
Home Financials for this Owner
Home Financials are based on the most recent Mortgage that was taken out on this home.
Original Mortgage
$87,200
Interest Rate
6.67%
Create a Home Valuation Report for This Property
The Home Valuation Report is an in-depth analysis detailing your home's value as well as a comparison with similar homes in the area
Home Values in the Area
Average Home Value in this Area
Purchase History
| Date | Buyer | Sale Price | Title Company |
|---|---|---|---|
| Chen Daniel | $150,000 | Whatcom Land Title Co Inc | |
| Klineburger Jan L | $193,780 | Stewart Title Company | |
| 927 Otis Llc | -- | Stewart Title Company | |
| 927 Otis Llc | -- | Stewart Title Company | |
| Dempsey Deborah D | $559,000 | Stewart Title |
Source: Public Records
Mortgage History
| Date | Status | Borrower | Loan Amount |
|---|---|---|---|
| Previous Owner | Klineburger Jan L | $145,125 | |
| Previous Owner | Dempsey Deborah D | $87,200 |
Source: Public Records
Tax History Compared to Growth
Tax History
| Year | Tax Paid | Tax Assessment Tax Assessment Total Assessment is a certain percentage of the fair market value that is determined by local assessors to be the total taxable value of land and additions on the property. | Land | Improvement |
|---|---|---|---|---|
| 2024 | $2,529 | $324,676 | $60,160 | $264,516 |
| 2023 | $2,529 | $324,676 | $60,160 | $264,516 |
| 2022 | $2,206 | $268,333 | $49,720 | $218,613 |
| 2021 | $2,125 | $237,463 | $44,000 | $193,463 |
| 2020 | $2,391 | $215,875 | $40,000 | $175,875 |
| 2019 | $1,972 | $234,834 | $64,548 | $170,286 |
| 2018 | $2,185 | $194,159 | $53,368 | $140,791 |
| 2017 | $1,809 | $183,924 | $50,540 | $133,384 |
| 2016 | $1,626 | $159,184 | $43,740 | $115,444 |
| 2015 | $1,642 | $148,892 | $40,940 | $107,952 |
| 2014 | -- | $145,525 | $40,000 | $105,525 |
| 2013 | -- | $146,484 | $39,150 | $107,334 |
Source: Public Records
Map
Nearby Homes
- 1205 E Maple St
- 1234 Grant St
- 616 E Myrtle St
- 615 E Myrtle St
- 1200 Lincoln St Unit 196
- 1200 Lincoln St Unit 117
- 1200 Lincoln St Unit 154
- 819 High St Unit 317
- 1309 Billy Frank Jr St
- 1126 N Forest St
- 805 Nevada St
- 901 N Forest St Unit 107
- 901 N Forest St Unit 125
- 901 N Forest St Unit 109
- 115 43rd St
- 310 E Ivy St
- 1001 N State St Unit 403
- 1031 N State St Unit 107
- 1031 N State St Unit 209
- 1401 Edwards St
- 927 Otis St Unit 3B
- 927 Otis St Unit 3A
- 927 Otis St Unit 2B
- 927 Otis St Unit 2A
- 927 Otis St Unit 1A
- 927 Otis St Unit S2
- 927 Otis St Unit S1
- 927 Otis St
- 927 Otis St Unit 3A 3B
- 933 Otis St
- 933 -935 Otis St
- 935 Otis St
- 939 Otis St
- 921 Otis St
- 917 Otis St
- 915 Otis St
- 926 Newell St
- 930 Newell St
- 1310 E Laurel St
- 1003 Otis St