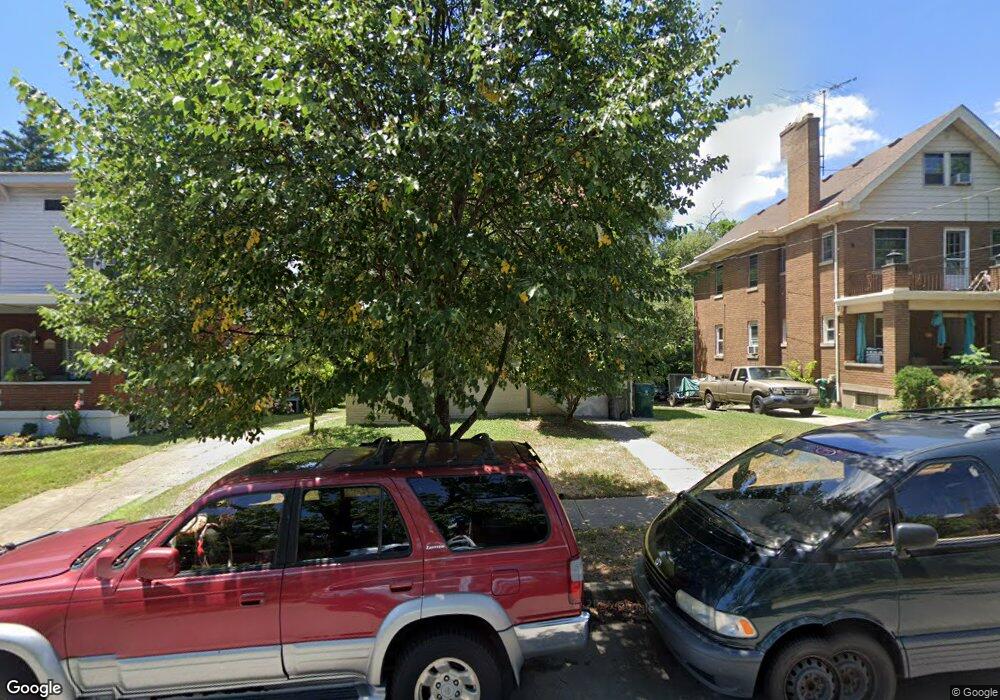
927 Rutledge Ave Cincinnati, OH 45205
West Price Hill NeighborhoodEstimated Value: $165,195 - $229,000
3
Beds
3
Baths
1,392
Sq Ft
$149/Sq Ft
Est. Value
About This Home
This home is located at 927 Rutledge Ave, Cincinnati, OH 45205 and is currently estimated at $207,799, approximately $149 per square foot. 927 Rutledge Ave is a home located in Hamilton County with nearby schools including Carson School, Gilbert A. Dater High School, and Western Hills High School.
Ownership History
Date
Name
Owned For
Owner Type
Purchase Details
Closed on
Nov 28, 2016
Sold by
Hamilton County Sheriff
Bought by
Quarra Properties Ltd
Current Estimated Value
Purchase Details
Closed on
Oct 16, 2007
Sold by
Lasalle Bank Na
Bought by
Scheper Chris
Purchase Details
Closed on
Jun 8, 2007
Sold by
Brunner Melissa M and Brunner Mark R
Bought by
Lasalle Bank Na and Mlmi Trust Series 2006-Sd1
Purchase Details
Closed on
Oct 14, 2005
Sold by
Rose Sharon L and Rose Trent
Bought by
Brunner Mark R and Brunner Melissa M
Home Financials for this Owner
Home Financials are based on the most recent Mortgage that was taken out on this home.
Original Mortgage
$97,750
Interest Rate
9.15%
Mortgage Type
Fannie Mae Freddie Mac
Purchase Details
Closed on
May 19, 1995
Sold by
Marmer Michael P and Marmer Kathlyn K
Bought by
Klute Sharon L
Home Financials for this Owner
Home Financials are based on the most recent Mortgage that was taken out on this home.
Original Mortgage
$66,400
Interest Rate
8.26%
Create a Home Valuation Report for This Property
The Home Valuation Report is an in-depth analysis detailing your home's value as well as a comparison with similar homes in the area
Home Values in the Area
Average Home Value in this Area
Purchase History
| Date | Buyer | Sale Price | Title Company |
|---|---|---|---|
| Quarra Properties Ltd | $22,600 | -- | |
| Scheper Chris | $37,900 | Attorney | |
| Lasalle Bank Na | $62,000 | None Available | |
| Brunner Mark R | $90,000 | First Title Agency Inc | |
| Klute Sharon L | -- | -- |
Source: Public Records
Mortgage History
| Date | Status | Borrower | Loan Amount |
|---|---|---|---|
| Previous Owner | Brunner Mark R | $97,750 | |
| Previous Owner | Klute Sharon L | $66,400 |
Source: Public Records
Tax History
| Year | Tax Paid | Tax Assessment Tax Assessment Total Assessment is a certain percentage of the fair market value that is determined by local assessors to be the total taxable value of land and additions on the property. | Land | Improvement |
|---|---|---|---|---|
| 2025 | $3,861 | $60,782 | $5,751 | $55,031 |
| 2024 | $2,568 | $40,401 | $5,751 | $34,650 |
| 2023 | $2,573 | $40,401 | $5,751 | $34,650 |
| 2022 | $964 | $13,475 | $5,712 | $7,763 |
| 2021 | $943 | $13,475 | $5,712 | $7,763 |
| 2020 | $946 | $13,475 | $5,712 | $7,763 |
| 2019 | $945 | $12,250 | $5,194 | $7,056 |
| 2018 | $945 | $12,250 | $5,194 | $7,056 |
| 2017 | $910 | $12,250 | $5,194 | $7,056 |
| 2016 | $1,793 | $23,674 | $5,551 | $18,123 |
| 2015 | $1,603 | $23,674 | $5,551 | $18,123 |
| 2014 | $1,612 | $23,674 | $5,551 | $18,123 |
| 2013 | $1,862 | $26,901 | $6,307 | $20,594 |
Source: Public Records
Map
Nearby Homes
- 4120 Saint Williams Ave
- 1034 Rutledge Ave
- 1026 Schiff Ave
- 4305 Saint Lawrence Ave
- 1031 Schiff Ave
- 4247 Eighth St W
- 1002 Winfield Ave
- 4261 Eighth St W
- 4526 Clearview Ave
- 4614 Midland Ave
- 4334 W 8th St
- 700 Trenton Ave
- 4340 Eighth St W
- 1226 Rutledge Ave
- 1110 Winfield Ave
- 831 Suire Ave
- 723 Wilbud Dr
- 4330 Schulte Dr
- 1113 Gilsey Ave
- 4419 Ridgeview Ave
- 929 Rutledge Ave
- 925 Rutledge Ave
- 931 Rutledge Ave
- 921 Rutledge Ave
- 933 Rutledge Ave
- 917 Rutledge Ave
- 937 Rutledge Ave
- 4149 Jamestown St
- 906 Kreis Ln
- 910 Kreis Ln
- 902 Kreis Ln
- 914 Kreis Ln
- 924 Rutledge Ave
- 4145 Jamestown St
- 911 Rutledge Ave
- 4159 Saint Lawrence Ave
- 922 Rutledge Ave
- 4155 Saint Lawrence Ave
- 852 Kreis Ln
- 918 Kreis Ln
Your Personal Tour Guide
Ask me questions while you tour the home.