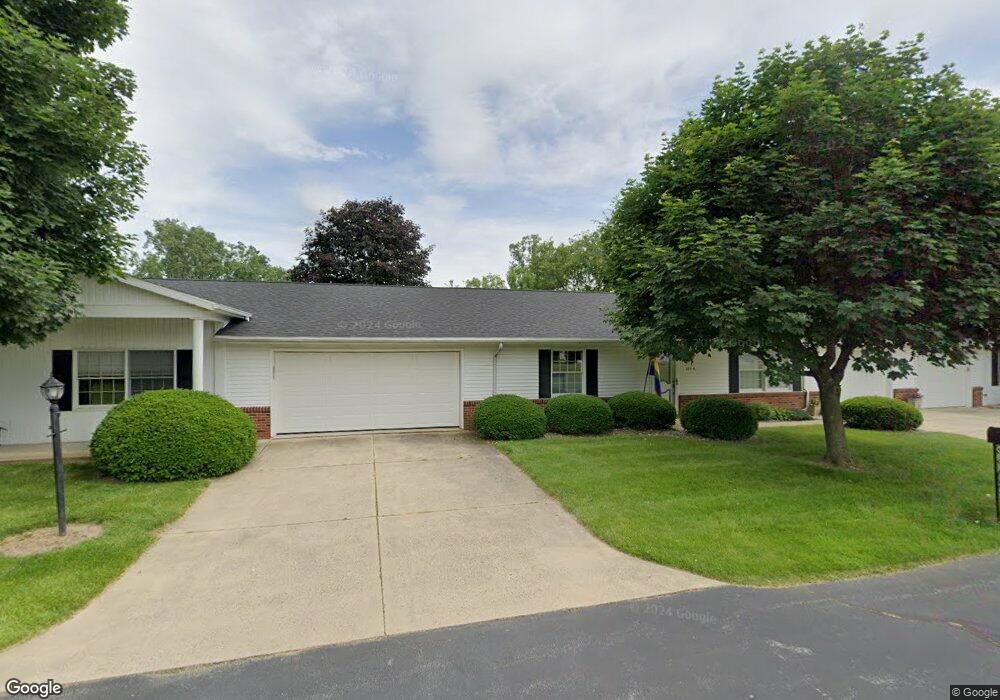
927 Tucker Ln Unit 927B Fremont, OH 43420
Estimated Value: $144,000 - $172,000
2
Beds
2
Baths
1,524
Sq Ft
$103/Sq Ft
Est. Value
About This Home
This home is located at 927 Tucker Ln Unit 927B, Fremont, OH 43420 and is currently estimated at $157,320, approximately $103 per square foot. 927 Tucker Ln Unit 927B is a home located in Sandusky County with nearby schools including Fremont Ross High School, St. Joseph School, and Bishop Hoffman Catholic School - This is St Joe's School now.
Ownership History
Date
Name
Owned For
Owner Type
Purchase Details
Closed on
Mar 11, 2016
Sold by
Ginnever James F
Bought by
Nones Eric Jon
Current Estimated Value
Purchase Details
Closed on
May 9, 2014
Sold by
Ginnever James F and Ginnever Joan C
Bought by
Ginnever James F
Purchase Details
Closed on
Mar 27, 2013
Sold by
Tornow Patricia L
Bought by
Ginnever James F and Ginnever Joan C
Purchase Details
Closed on
Jul 18, 2008
Sold by
Arnold Linda S
Bought by
Tornow Patricia L
Home Financials for this Owner
Home Financials are based on the most recent Mortgage that was taken out on this home.
Original Mortgage
$83,000
Interest Rate
6.15%
Mortgage Type
Purchase Money Mortgage
Purchase Details
Closed on
Jul 17, 2003
Sold by
Gnepper Robert W
Bought by
Brokate Faye L
Create a Home Valuation Report for This Property
The Home Valuation Report is an in-depth analysis detailing your home's value as well as a comparison with similar homes in the area
Home Values in the Area
Average Home Value in this Area
Purchase History
| Date | Buyer | Sale Price | Title Company |
|---|---|---|---|
| Nones Eric Jon | $85,200 | Attorney | |
| Ginnever James F | -- | Attorney | |
| Ginnever James F | $100,000 | First Am Title | |
| Tornow Patricia L | $79,500 | First American Title | |
| Brokate Faye L | $86,250 | Culbert Title Agency |
Source: Public Records
Mortgage History
| Date | Status | Borrower | Loan Amount |
|---|---|---|---|
| Previous Owner | Tornow Patricia L | $83,000 |
Source: Public Records
Tax History Compared to Growth
Tax History
| Year | Tax Paid | Tax Assessment Tax Assessment Total Assessment is a certain percentage of the fair market value that is determined by local assessors to be the total taxable value of land and additions on the property. | Land | Improvement |
|---|---|---|---|---|
| 2024 | $1,185 | $40,290 | $6,690 | $33,600 |
| 2023 | $1,185 | $31,710 | $5,250 | $26,460 |
| 2022 | $1,316 | $31,710 | $5,250 | $26,460 |
| 2021 | $1,356 | $31,710 | $5,250 | $26,460 |
| 2020 | $1,365 | $31,290 | $7,000 | $24,290 |
| 2019 | $1,363 | $31,290 | $7,000 | $24,290 |
| 2018 | $1,330 | $31,290 | $7,000 | $24,290 |
| 2017 | $1,334 | $31,290 | $7,000 | $24,290 |
| 2016 | $1,169 | $31,290 | $7,000 | $24,290 |
| 2015 | $1,150 | $31,290 | $7,000 | $24,290 |
| 2014 | $1,155 | $30,100 | $7,560 | $22,540 |
| 2013 | $1,131 | $30,100 | $7,560 | $22,540 |
Source: Public Records
Map
Nearby Homes
- 2484 Buckland Ave
- 1719 Buckland Ave
- 1485 Autumn Woods Dr
- 1420 Center St
- 1611 Mcpherson Blvd
- 515 Everett Rd
- 10 Meadowbrook Dr
- 10 Meadowbrook Ln
- 64 River Run Dr Unit J
- 1028 June St
- 2119 Lake St
- 1013 Whittlesey St
- 1015 Hayes Ave
- 905 Twinn St
- 1037 Buckland Ave
- 815 South St
- 616 S Wood St
- 135 Briarwood Cir
- 1823 W State St
- 1009 Napoleon St
- 927 Tucker Ln Unit 927A
- 949 Tucker Ln
- 949 Tucker Ln
- 927 Tucker Ln
- 949 Tucker Ln
- 927 Tucker Ln Unit c
- 927 Tucker Ln Unit B
- 927 Tucker Ln Unit A
- 961 Tucker Ln Unit 961A
- 915 Tucker Ln Unit 915B
- 915 Tucker Ln Unit 915A
- 961 Tucker Ln
- 915 Tucker Ln
- 915 Tucker Ln Unit A
- 961 Tucker Ln Unit A
- 915 Tucker Ln Unit B
- 915 Creek 953 Unit A
- 36 Shaker Ct
- 34 Shaker Ct Unit 502
- 907 Tucker Rd