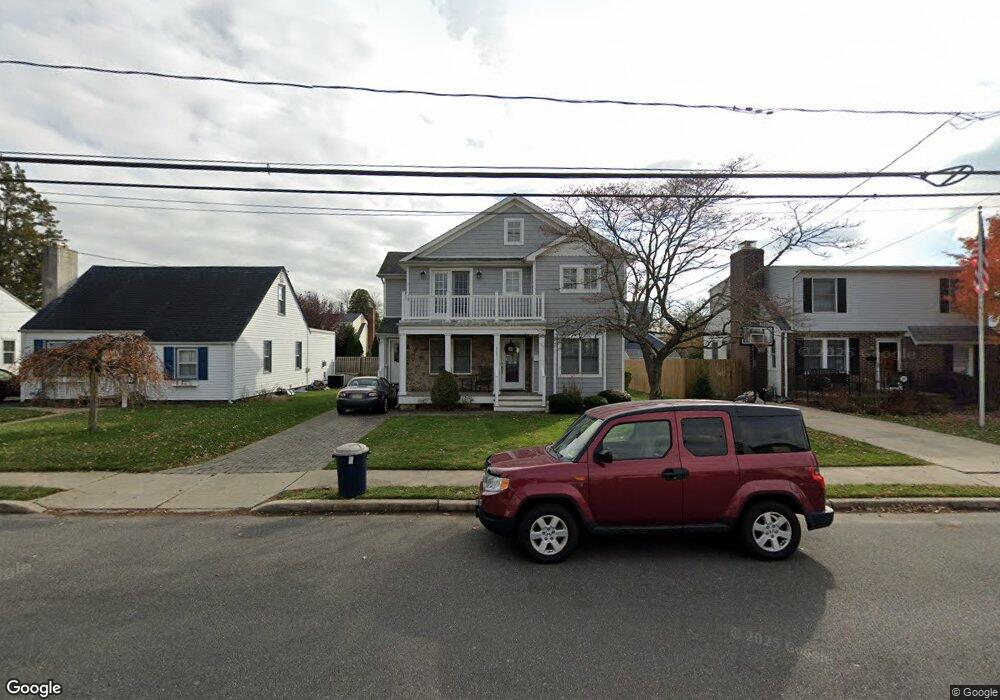
927 Wall Rd Spring Lake, NJ 07762
Estimated Value: $1,141,000 - $1,565,000
3
Beds
3
Baths
2,270
Sq Ft
$587/Sq Ft
Est. Value
About This Home
This home is located at 927 Wall Rd, Spring Lake, NJ 07762 and is currently estimated at $1,331,941, approximately $586 per square foot. 927 Wall Rd is a home located in Monmouth County with nearby schools including Spring Lake Heights Elementary School and The Brookside School.
Ownership History
Date
Name
Owned For
Owner Type
Purchase Details
Closed on
Oct 19, 2006
Sold by
Osprey Enterprises At Sea Girt
Bought by
Vanbelle Barbara E
Current Estimated Value
Home Financials for this Owner
Home Financials are based on the most recent Mortgage that was taken out on this home.
Original Mortgage
$486,000
Outstanding Balance
$290,326
Interest Rate
6.48%
Estimated Equity
$1,041,615
Purchase Details
Closed on
May 22, 2006
Sold by
Eckert Jon
Bought by
Osprey Enterprises At Sea Girt
Purchase Details
Closed on
Feb 9, 2006
Sold by
Estate Of Gary Lee Nesbitt
Bought by
Eckert Jon
Home Financials for this Owner
Home Financials are based on the most recent Mortgage that was taken out on this home.
Original Mortgage
$264,000
Interest Rate
8%
Mortgage Type
Adjustable Rate Mortgage/ARM
Create a Home Valuation Report for This Property
The Home Valuation Report is an in-depth analysis detailing your home's value as well as a comparison with similar homes in the area
Home Values in the Area
Average Home Value in this Area
Purchase History
| Date | Buyer | Sale Price | Title Company |
|---|---|---|---|
| Vanbelle Barbara E | $673,000 | -- | |
| Osprey Enterprises At Sea Girt | -- | -- | |
| Eckert Jon | $330,000 | -- |
Source: Public Records
Mortgage History
| Date | Status | Borrower | Loan Amount |
|---|---|---|---|
| Open | Vanbelle Barbara E | $486,000 | |
| Previous Owner | Eckert Jon | $264,000 |
Source: Public Records
Tax History
| Year | Tax Paid | Tax Assessment Tax Assessment Total Assessment is a certain percentage of the fair market value that is determined by local assessors to be the total taxable value of land and additions on the property. | Land | Improvement |
|---|---|---|---|---|
| 2025 | $9,072 | $923,800 | $486,700 | $437,100 |
| 2024 | $9,587 | $861,500 | $432,500 | $429,000 |
Source: Public Records
Map
Nearby Homes
- 2419 Kipling Ave
- 809 Wall Rd
- 815 Woodcrest Dr
- 23 Locust Way
- 1838 Highway 35 Unit 36
- 1838 State Route 35 Unit 10
- 16 Cherry Ct
- 27 Apple Dr
- 1731 Grove St
- 1210 Xanadu Ln Unit A1210
- 2005 Nassau Dr
- 513 Mercer Ave
- 530 Highway 71 Unit 4
- 217 Pitney Ave
- 604 Monmouth Ave
- 2208 2nd Ave
- 1805 Margerum Ave
- 1644 Riverview Terrace
- 1826 New Bedford Rd
- 117 Madison Ave
Your Personal Tour Guide
Ask me questions while you tour the home.