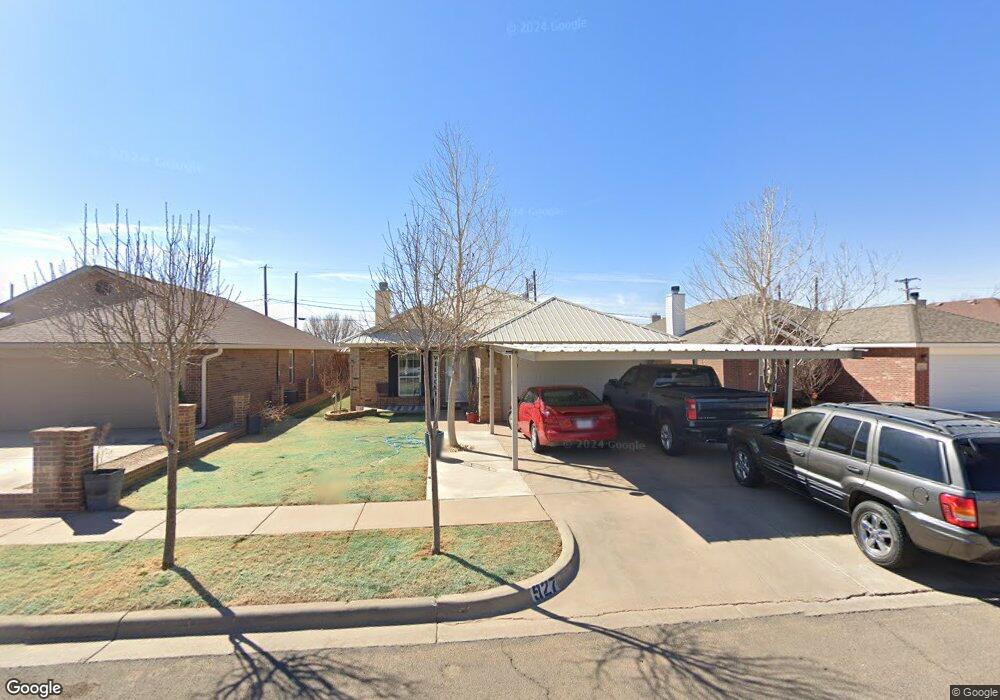
927 Xavier St Lubbock, TX 79403
North Lubbock NeighborhoodEstimated Value: $161,000 - $181,000
3
Beds
2
Baths
1,460
Sq Ft
$116/Sq Ft
Est. Value
About This Home
This home is located at 927 Xavier St, Lubbock, TX 79403 and is currently estimated at $169,096, approximately $115 per square foot. 927 Xavier St is a home located in Lubbock County with nearby schools including Cavazos Middle School, Lubbock High School, and Lisd State School.
Ownership History
Date
Name
Owned For
Owner Type
Purchase Details
Closed on
Nov 21, 2017
Sold by
Diaz Jeronimo O
Bought by
Castro Paul
Current Estimated Value
Purchase Details
Closed on
Oct 31, 2013
Sold by
Medlock Adam W
Bought by
Diaz Jeronimo O and Diaz Maria
Home Financials for this Owner
Home Financials are based on the most recent Mortgage that was taken out on this home.
Original Mortgage
$91,110
Interest Rate
4.37%
Mortgage Type
VA
Purchase Details
Closed on
Dec 17, 2008
Sold by
Lara Steven and Lara Kelly D
Bought by
Diaz Jeronimo O and Diaz Maria
Purchase Details
Closed on
Dec 14, 2006
Sold by
Lubbock Quality Homes Ii Ltd
Bought by
Lara Steven and Lara Kelly D
Home Financials for this Owner
Home Financials are based on the most recent Mortgage that was taken out on this home.
Original Mortgage
$86,069
Interest Rate
6.27%
Mortgage Type
Purchase Money Mortgage
Create a Home Valuation Report for This Property
The Home Valuation Report is an in-depth analysis detailing your home's value as well as a comparison with similar homes in the area
Home Values in the Area
Average Home Value in this Area
Purchase History
| Date | Buyer | Sale Price | Title Company |
|---|---|---|---|
| Castro Paul | -- | None Available | |
| Diaz Jeronimo O | -- | Service Title | |
| Diaz Jeronimo O | -- | -- | |
| Lara Steven | -- | Stl |
Source: Public Records
Mortgage History
| Date | Status | Borrower | Loan Amount |
|---|---|---|---|
| Previous Owner | Diaz Jeronimo O | $91,110 | |
| Previous Owner | Lara Steven | $86,069 |
Source: Public Records
Tax History
| Year | Tax Paid | Tax Assessment Tax Assessment Total Assessment is a certain percentage of the fair market value that is determined by local assessors to be the total taxable value of land and additions on the property. | Land | Improvement |
|---|---|---|---|---|
| 2025 | $3,199 | $176,150 | $27,500 | $148,650 |
| 2024 | $32 | $176,150 | $27,500 | $148,650 |
| 2023 | $3,291 | $177,024 | $10,000 | $167,024 |
| 2022 | $3,725 | $184,004 | $10,000 | $174,004 |
| 2021 | $3,206 | $149,712 | $10,000 | $139,712 |
| 2020 | $2,853 | $131,224 | $10,000 | $121,224 |
| 2019 | $2,887 | $128,598 | $10,000 | $118,598 |
| 2018 | $2,158 | $96,009 | $10,000 | $86,009 |
| 2017 | $2,670 | $118,633 | $10,000 | $108,633 |
| 2016 | $2,697 | $119,815 | $10,000 | $109,815 |
| 2015 | $2,382 | $112,288 | $10,000 | $102,288 |
| 2014 | $2,382 | $107,139 | $10,000 | $97,139 |
Source: Public Records
Map
Nearby Homes
- 906 Xavier St Unit 1
- 917 Adrian St
- 2114 N Avenue K
- 909 Bradley St
- 1313 Adrian St
- 2210 N Ave N
- 0 Adrian St
- 2102 N Ridge Rd
- 3407 Canyon Rd
- 307 E Tulane St
- 316 E Ursuline St
- 506 E Ursuline St
- 121 E Kemper St
- 2119 Edgewood St
- 2123 Edgewood St
- 2124 Edgewood St
- 2126 Edgewood St
- 505 Owen St
- 1509 E Tulane St
- 501 Owen St
Your Personal Tour Guide
Ask me questions while you tour the home.