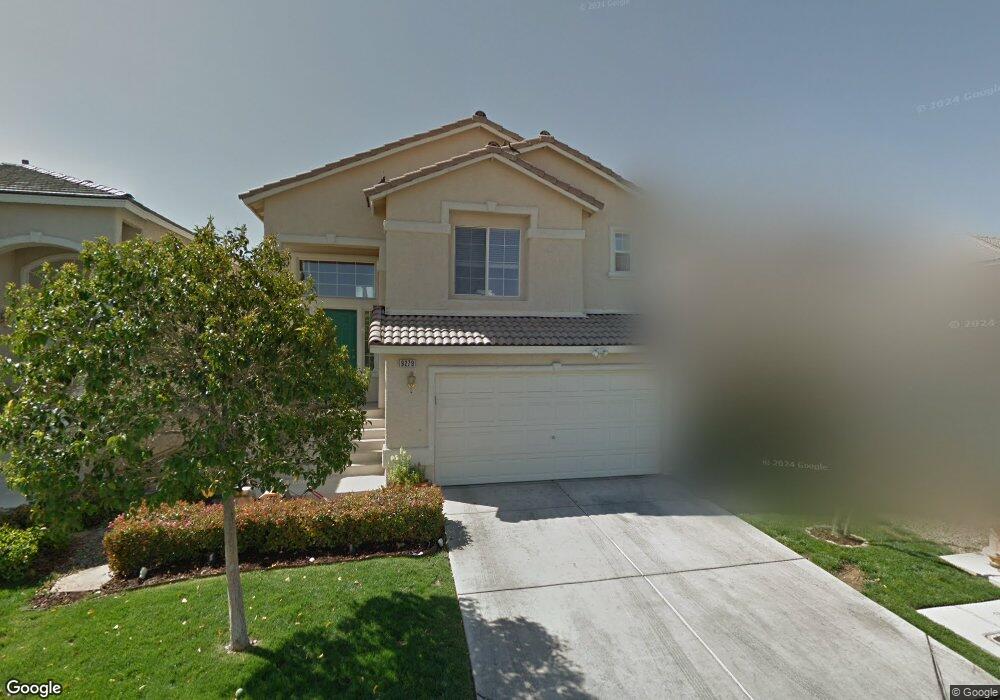
9279 Shellmont Ct Unit 1 Las Vegas, NV 89148
Estimated Value: $423,124 - $441,000
2
Beds
3
Baths
1,677
Sq Ft
$258/Sq Ft
Est. Value
About This Home
This home is located at 9279 Shellmont Ct Unit 1, Las Vegas, NV 89148 and is currently estimated at $432,031, approximately $257 per square foot. 9279 Shellmont Ct Unit 1 is a home located in Clark County with nearby schools including Wayne N. Tanaka Elementary School, Wilbur & Theresa Faiss Middle School, and Sierra Vista High School.
Ownership History
Date
Name
Owned For
Owner Type
Purchase Details
Closed on
Oct 7, 2020
Sold by
Rannazzisi Jack J and Rannazzisi Amy M
Bought by
Rannazzisi Amy Mcquilkin and Rannazzisi Jack Jean
Current Estimated Value
Purchase Details
Closed on
Jul 14, 2016
Sold by
Rannazzisi Jack and Rannazzisi Amy Mcquilkin
Bought by
Rannazzisi Jack J and Rannazzisi Amy M
Purchase Details
Closed on
Feb 20, 2003
Sold by
Astoria R R 22 Llc
Bought by
Rannazzisi Jack and Rannazzisi Amy K
Home Financials for this Owner
Home Financials are based on the most recent Mortgage that was taken out on this home.
Original Mortgage
$137,450
Interest Rate
5.89%
Create a Home Valuation Report for This Property
The Home Valuation Report is an in-depth analysis detailing your home's value as well as a comparison with similar homes in the area
Home Values in the Area
Average Home Value in this Area
Purchase History
| Date | Buyer | Sale Price | Title Company |
|---|---|---|---|
| Rannazzisi Amy Mcquilkin | -- | Noble Title | |
| Rannazzisi Jack J | -- | None Available | |
| Rannazzisi Jack | $171,823 | First American Title Company |
Source: Public Records
Mortgage History
| Date | Status | Borrower | Loan Amount |
|---|---|---|---|
| Previous Owner | Rannazzisi Jack | $137,450 | |
| Closed | Rannazzisi Jack | $34,350 |
Source: Public Records
Tax History Compared to Growth
Tax History
| Year | Tax Paid | Tax Assessment Tax Assessment Total Assessment is a certain percentage of the fair market value that is determined by local assessors to be the total taxable value of land and additions on the property. | Land | Improvement |
|---|---|---|---|---|
| 2025 | $1,832 | $110,988 | $38,500 | $72,488 |
| 2024 | $1,779 | $110,988 | $38,500 | $72,488 |
| 2023 | $1,779 | $101,733 | $33,250 | $68,483 |
| 2022 | $1,728 | $90,561 | $28,000 | $62,561 |
| 2021 | $1,677 | $83,961 | $24,500 | $59,461 |
| 2020 | $1,626 | $82,305 | $23,450 | $58,855 |
| 2019 | $1,606 | $78,912 | $21,000 | $57,912 |
| 2018 | $1,532 | $71,995 | $16,450 | $55,545 |
| 2017 | $2,111 | $71,993 | $15,750 | $56,243 |
| 2016 | $1,435 | $64,040 | $11,900 | $52,140 |
| 2015 | $1,432 | $55,617 | $10,850 | $44,767 |
| 2014 | $1,390 | $45,973 | $6,300 | $39,673 |
Source: Public Records
Map
Nearby Homes
- 9299 Adamshurst Ave
- 9267 Shellmont Ct
- 9272 Keaton Ave
- 7264 Morrison St
- 9289 Nerone Ave
- 0 Fort Apache Unit 2719841
- 9229 Millikan Ave
- 9123 Hilverson Ave
- 9119 Glennon Ave
- 9050 W Warm Springs Rd Unit 1051
- 9050 W Warm Springs Rd Unit 1164
- 9050 W Warm Springs Rd Unit 2058
- 9050 W Warm Springs Rd Unit 2139
- 9050 W Warm Springs Rd Unit 2054
- 9050 W Warm Springs Rd Unit 2177
- 9074 Glennon Ave
- 7457 Margollini St
- 8278 Kinleigh Poulson St
- 8272 Kinleigh Poulson St
- 8266 Kinleigh Poulson St
- 9285 Shellmont Ct
- 9273 Shellmont Ct Unit 1
- 9291 Shellmont Ct
- 9267 Shellmont Ct Unit n/a
- 9297 Shellmont Ct
- 9261 Shellmont Ct
- 9278 Shellmont Ct
- 9281 Adamshurst Ave
- 9272 Shellmont Ct
- 9287 Adamshurst Ave Unit 1
- 9287 Adamshurst Ave Unit n/a
- 9284 Shellmont Ct
- 9275 Adamshurst Ave
- 9255 Shellmont Ct
- 7172 Plushstone St
- 9266 Shellmont Ct
- 7168 Plushstone St
- 9293 Adamshurst Ave
- 9290 Shellmont Ct
- 9269 Adamshurst Ave