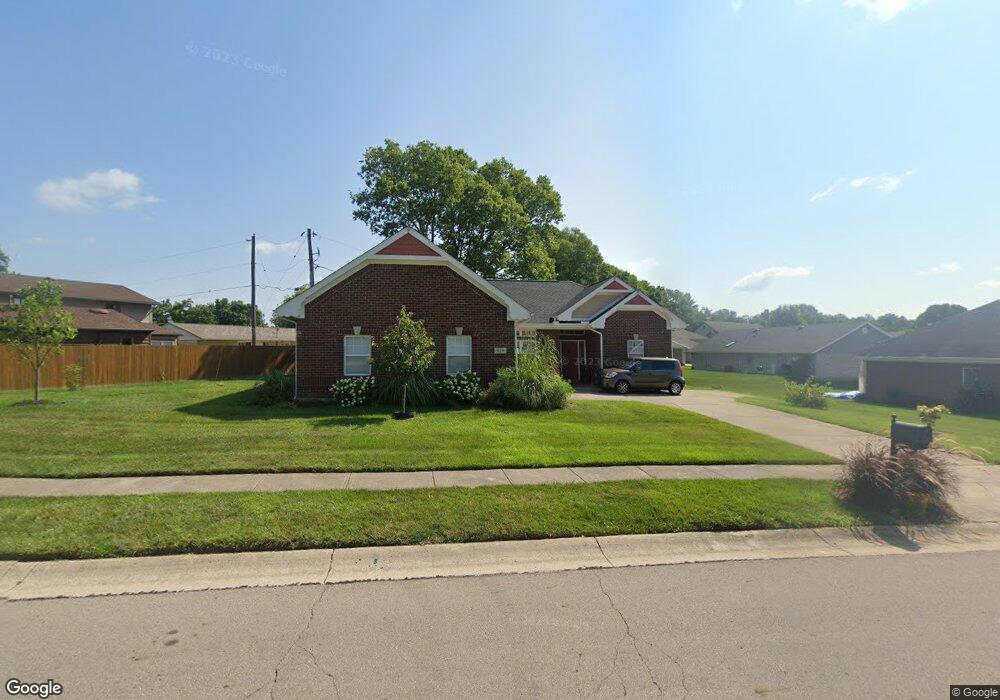
928 Blanche Dr Miamisburg, OH 45342
Downtown Miamisburg NeighborhoodEstimated Value: $264,414 - $314,000
3
Beds
2
Baths
1,676
Sq Ft
$167/Sq Ft
Est. Value
About This Home
This home is located at 928 Blanche Dr, Miamisburg, OH 45342 and is currently estimated at $279,604, approximately $166 per square foot. 928 Blanche Dr is a home located in Montgomery County with nearby schools including West Carrollton High School and Bethel Baptist School.
Ownership History
Date
Name
Owned For
Owner Type
Purchase Details
Closed on
Mar 23, 2016
Sold by
Fannie Mae
Bought by
Tyler Pamela
Current Estimated Value
Home Financials for this Owner
Home Financials are based on the most recent Mortgage that was taken out on this home.
Original Mortgage
$133,340
Outstanding Balance
$105,887
Interest Rate
3.75%
Mortgage Type
FHA
Estimated Equity
$173,717
Purchase Details
Closed on
Jul 28, 2004
Sold by
Harmon Donald R and Harmon Barbara J
Bought by
Elford Edward C and Elford Therese
Purchase Details
Closed on
Jan 12, 2004
Sold by
Miamisburg Development Llc
Bought by
Schmidt Builders Inc
Purchase Details
Closed on
May 3, 2002
Sold by
Harmon Donald R and Harmon Barbara J
Bought by
Harmon Donald R and Harmon Barbara J
Home Financials for this Owner
Home Financials are based on the most recent Mortgage that was taken out on this home.
Original Mortgage
$142,500
Interest Rate
7.1%
Create a Home Valuation Report for This Property
The Home Valuation Report is an in-depth analysis detailing your home's value as well as a comparison with similar homes in the area
Home Values in the Area
Average Home Value in this Area
Purchase History
| Date | Buyer | Sale Price | Title Company |
|---|---|---|---|
| Tyler Pamela | -- | Nova Title Agency Inc | |
| Elford Edward C | $172,000 | -- | |
| Schmidt Builders Inc | $90,800 | -- | |
| Harmon Donald R | -- | Ohio Clear Title Agency Inc |
Source: Public Records
Mortgage History
| Date | Status | Borrower | Loan Amount |
|---|---|---|---|
| Open | Tyler Pamela | $133,340 | |
| Previous Owner | Harmon Donald R | $142,500 |
Source: Public Records
Tax History Compared to Growth
Tax History
| Year | Tax Paid | Tax Assessment Tax Assessment Total Assessment is a certain percentage of the fair market value that is determined by local assessors to be the total taxable value of land and additions on the property. | Land | Improvement |
|---|---|---|---|---|
| 2024 | $3,914 | $61,620 | $14,280 | $47,340 |
| 2023 | $3,914 | $61,620 | $14,280 | $47,340 |
| 2022 | $4,549 | $60,420 | $14,000 | $46,420 |
| 2021 | $4,023 | $60,420 | $14,000 | $46,420 |
| 2020 | $4,014 | $60,420 | $14,000 | $46,420 |
| 2019 | $3,914 | $54,060 | $14,000 | $40,060 |
| 2018 | $3,927 | $54,060 | $14,000 | $40,060 |
| 2017 | $3,901 | $54,060 | $14,000 | $40,060 |
| 2016 | $4,262 | $55,430 | $14,000 | $41,430 |
| 2015 | $4,066 | $55,430 | $14,000 | $41,430 |
| 2014 | $4,066 | $55,430 | $14,000 | $41,430 |
| 2012 | -- | $51,150 | $15,750 | $35,400 |
Source: Public Records
Map
Nearby Homes
- 00 Heincke Rd
- 308 Ironwood Dr
- 860 Mardel Dr
- 00 Graceland Dr
- 765 Heincke Rd
- 257 Ironwood Dr
- 250 Grantwood Dr
- 429 Wilson Park Dr
- 758 Cransberry Dr
- 1109 Sundance Dr
- 1000 Skyview Dr
- 1026 Esther Ave
- 1232 Hollyhill Dr
- 1803 Cudgell Dr
- 624 Skyview Dr
- 857 Lea Castle Place
- 1121 Dayket Cir
- 2125 Sherwood Forest Dr
- 838 Maid Marion Ct
- 1100 S Elm St
- 324 Applehill Dr
- 328 Applehill Dr
- 1401 Overcliff Ct
- 1411 Overcliff Ct
- 320 Applehill Dr
- 941 Blanche Dr
- 1421 Overcliff Ct
- 316 Applehill Dr
- 933 Blanche Dr
- 945 Blanche Dr
- 937 Blanche Dr
- 929 Blanche Dr
- 325 Applehill Dr
- 924 Blanche Dr
- 949 Blanche Dr
- 312 Applehill Dr
- 321 Applehill Dr
- 925 Blanche Dr
- 317 Applehill Dr
- 1400 Overcliff Ct