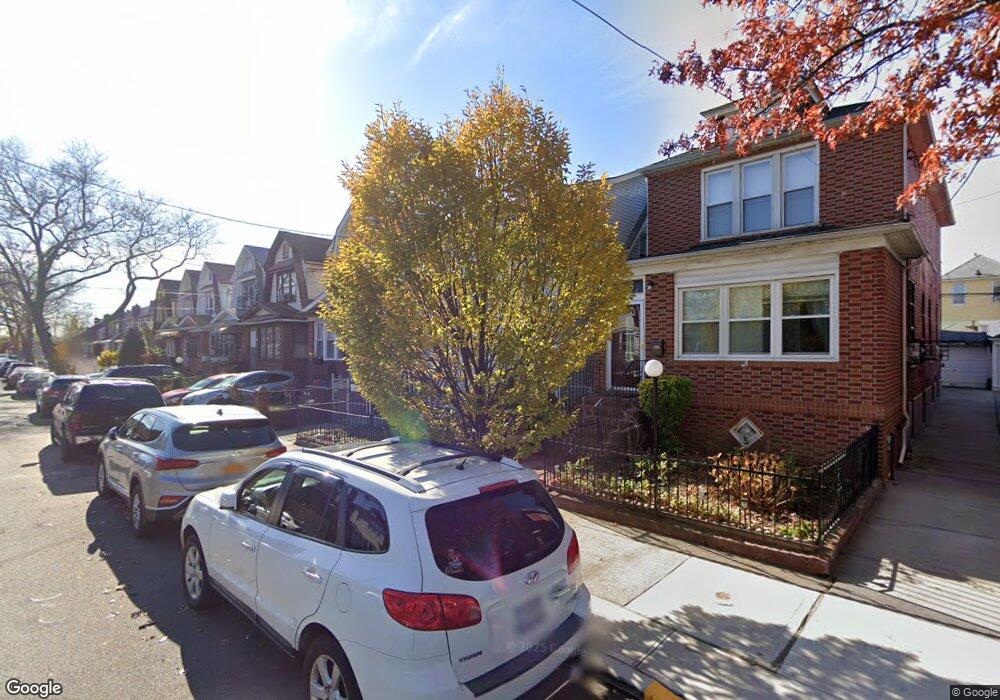
928 E 49th St Brooklyn, NY 11203
East Flatbush NeighborhoodEstimated Value: $655,413 - $766,000
Studio
--
Bath
1,520
Sq Ft
$472/Sq Ft
Est. Value
About This Home
This home is located at 928 E 49th St, Brooklyn, NY 11203 and is currently estimated at $716,853, approximately $471 per square foot. 928 E 49th St is a home located in Kings County with nearby schools including P.S. 208 Elsa Ebeling, I.S. 285 Meyer Levin, and Ivy Hill Preparatory Charter School.
Ownership History
Date
Name
Owned For
Owner Type
Purchase Details
Closed on
Jun 15, 2018
Sold by
Albert Baker And Cecily Baker Rev Tr Dtd
Bought by
Hepburn Elizabeth Jennifer
Current Estimated Value
Home Financials for this Owner
Home Financials are based on the most recent Mortgage that was taken out on this home.
Original Mortgage
$420,000
Outstanding Balance
$363,230
Interest Rate
4.5%
Mortgage Type
Purchase Money Mortgage
Estimated Equity
$353,623
Purchase Details
Closed on
Aug 1, 2016
Sold by
Baker Albert
Bought by
Albert Baker And Cecily Baker Revocable and Albert Baker, As Trustee
Create a Home Valuation Report for This Property
The Home Valuation Report is an in-depth analysis detailing your home's value as well as a comparison with similar homes in the area
Home Values in the Area
Average Home Value in this Area
Purchase History
| Date | Buyer | Sale Price | Title Company |
|---|---|---|---|
| Hepburn Elizabeth Jennifer | $525,000 | -- | |
| Albert Baker And Cecily Baker Revocable | -- | -- |
Source: Public Records
Mortgage History
| Date | Status | Borrower | Loan Amount |
|---|---|---|---|
| Open | Hepburn Elizabeth Jennifer | $420,000 |
Source: Public Records
Tax History
| Year | Tax Paid | Tax Assessment Tax Assessment Total Assessment is a certain percentage of the fair market value that is determined by local assessors to be the total taxable value of land and additions on the property. | Land | Improvement |
|---|---|---|---|---|
| 2025 | $5,717 | $38,340 | $12,360 | $25,980 |
| 2024 | $5,717 | $45,120 | $12,360 | $32,760 |
| 2023 | $5,528 | $43,140 | $12,360 | $30,780 |
| 2022 | $5,126 | $37,500 | $12,360 | $25,140 |
| 2021 | $5,404 | $36,840 | $12,360 | $24,480 |
| 2019 | $4,669 | $38,940 | $12,360 | $26,580 |
| 2018 | $4,745 | $22,681 | $7,866 | $14,815 |
| 2016 | $3,968 | $21,398 | $10,299 | $11,099 |
| 2015 | $2,215 | $20,953 | $12,528 | $8,425 |
| 2014 | $2,215 | $19,767 | $11,122 | $8,645 |
Source: Public Records
Map
Nearby Homes
Your Personal Tour Guide
Ask me questions while you tour the home.