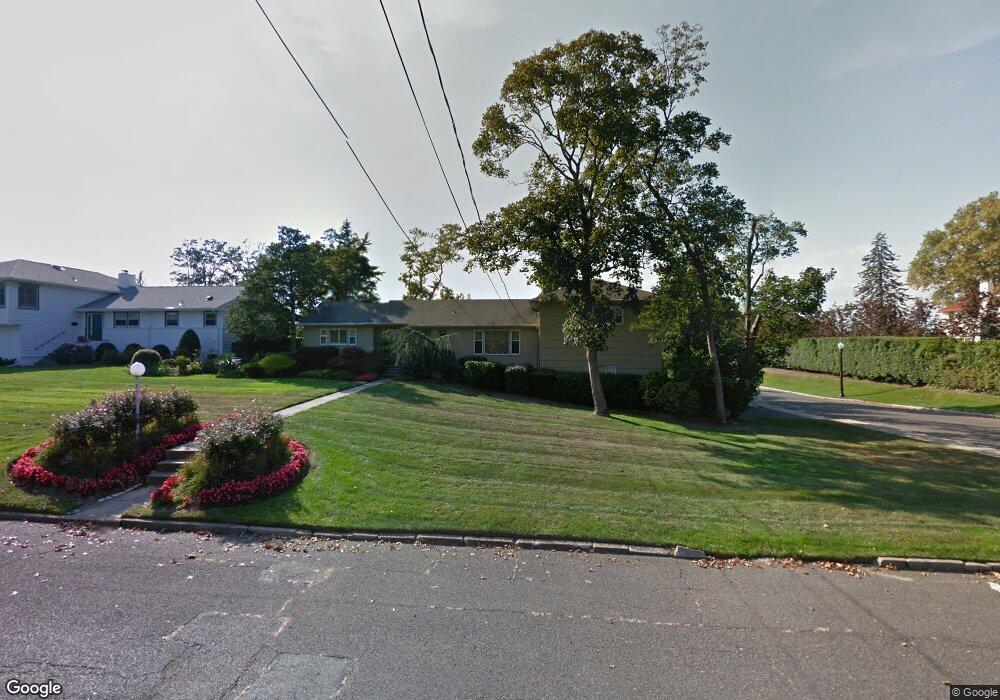
928 Elberon Ave Long Branch, NJ 07740
Estimated Value: $2,123,000 - $3,544,000
4
Beds
4
Baths
3,159
Sq Ft
$894/Sq Ft
Est. Value
About This Home
This home is located at 928 Elberon Ave, Long Branch, NJ 07740 and is currently estimated at $2,825,148, approximately $894 per square foot. 928 Elberon Ave is a home located in Monmouth County with nearby schools including Long Branch High School, Holy Trinity School, and Bet Yaakov of the Jersey Shore.
Ownership History
Date
Name
Owned For
Owner Type
Purchase Details
Closed on
Dec 1, 2023
Sold by
Moyal Solomon and Erani Fred
Bought by
Sm 928 Elberon Llc and Dm 928 Elberon Llc
Current Estimated Value
Purchase Details
Closed on
Mar 29, 2023
Sold by
Mavorah Family Trust
Bought by
Moyal Solomon and Erani Fred
Home Financials for this Owner
Home Financials are based on the most recent Mortgage that was taken out on this home.
Original Mortgage
$1,777,500
Interest Rate
6.75%
Mortgage Type
New Conventional
Purchase Details
Closed on
Mar 18, 2021
Sold by
Mavorah Arleen and Mavorah Elliot
Bought by
Maltzman Cori and Mavorah Family Trust
Purchase Details
Closed on
May 30, 1997
Sold by
Schapiro C Gilbert
Bought by
Mavorah Elliot
Home Financials for this Owner
Home Financials are based on the most recent Mortgage that was taken out on this home.
Original Mortgage
$225,000
Interest Rate
7.81%
Create a Home Valuation Report for This Property
The Home Valuation Report is an in-depth analysis detailing your home's value as well as a comparison with similar homes in the area
Home Values in the Area
Average Home Value in this Area
Purchase History
| Date | Buyer | Sale Price | Title Company |
|---|---|---|---|
| Sm 928 Elberon Llc | $1,871,059 | Oceanview Title | |
| Sm 928 Elberon Llc | $1,871,059 | Oceanview Title | |
| Moyal Solomon | $2,370,000 | Chicago Title | |
| Moyal Solomon | $2,370,000 | Chicago Title | |
| Maltzman Cori | -- | None Available | |
| Mavorah Family Trust | -- | None Listed On Document | |
| Mavorah Elliot | $313,500 | -- |
Source: Public Records
Mortgage History
| Date | Status | Borrower | Loan Amount |
|---|---|---|---|
| Previous Owner | Moyal Solomon | $1,777,500 | |
| Previous Owner | Mavorah Elliot | $225,000 |
Source: Public Records
Tax History Compared to Growth
Tax History
| Year | Tax Paid | Tax Assessment Tax Assessment Total Assessment is a certain percentage of the fair market value that is determined by local assessors to be the total taxable value of land and additions on the property. | Land | Improvement |
|---|---|---|---|---|
| 2025 | $24,764 | $1,679,000 | $811,500 | $867,500 |
| 2024 | $21,402 | $1,611,200 | $781,500 | $829,700 |
| 2023 | $21,402 | $1,378,100 | $731,400 | $646,700 |
| 2022 | $20,223 | $1,130,000 | $560,300 | $569,700 |
| 2021 | $20,223 | $1,060,600 | $527,800 | $532,800 |
| 2020 | $21,460 | $1,026,800 | $497,100 | $529,700 |
| 2019 | $21,024 | $1,000,200 | $495,200 | $505,000 |
| 2018 | $21,641 | $1,023,700 | $537,100 | $486,600 |
| 2017 | $20,907 | $1,014,400 | $537,100 | $477,300 |
| 2016 | $20,533 | $1,016,000 | $551,000 | $465,000 |
| 2015 | $17,934 | $805,300 | $419,700 | $385,600 |
| 2014 | $16,659 | $788,400 | $446,200 | $342,200 |
Source: Public Records
Map
Nearby Homes
- 807 Ocean Ave
- 251 Highland Ave
- 735 Greens Ave Unit 18A
- 2 Jim Lynch Dr
- 787 Ocean Ave Unit 314
- 787 Ocean Ave Unit 508
- 787 Ocean Ave Unit 1712
- 3 Reid St
- 280 Cummings Ave
- 35 Sternberger Ave Unit P
- 717 Ocean Ave Unit 512
- 717 Ocean Ave Unit 705
- 45 Cedar Ave
- 65 Cedar Ave Unit C11
- 211 Cedar Ave
- 316 Oakley Ave
- 4 Clarence Ave
- 665 2nd Ave Unit 202
- 665 2nd Ave Unit 201
- 631 Hoey Ave
- 936 Elberon Ave
- 944 Elberon Ave
- 876 Elberon Ave
- 933 Elberon Ave
- 925 Elberon Ave
- 941 Elberon Ave
- 917 Elberon Ave
- 952 Elberon Ave
- 91 Pullman Ave
- 1 Harry Ln
- 909 Elberon Ave
- 960 Elberon Ave
- 29 Jim Lynch Dr
- 74 Pullman Ave
- 27 Jim Lynch Dr
- 892 Elberon Ave Unit Studio
- 892 Elberon Ave
- 892 Elberon Ave Unit WINTER
- 959 Elberon Ave
- 918 Ocean Ave