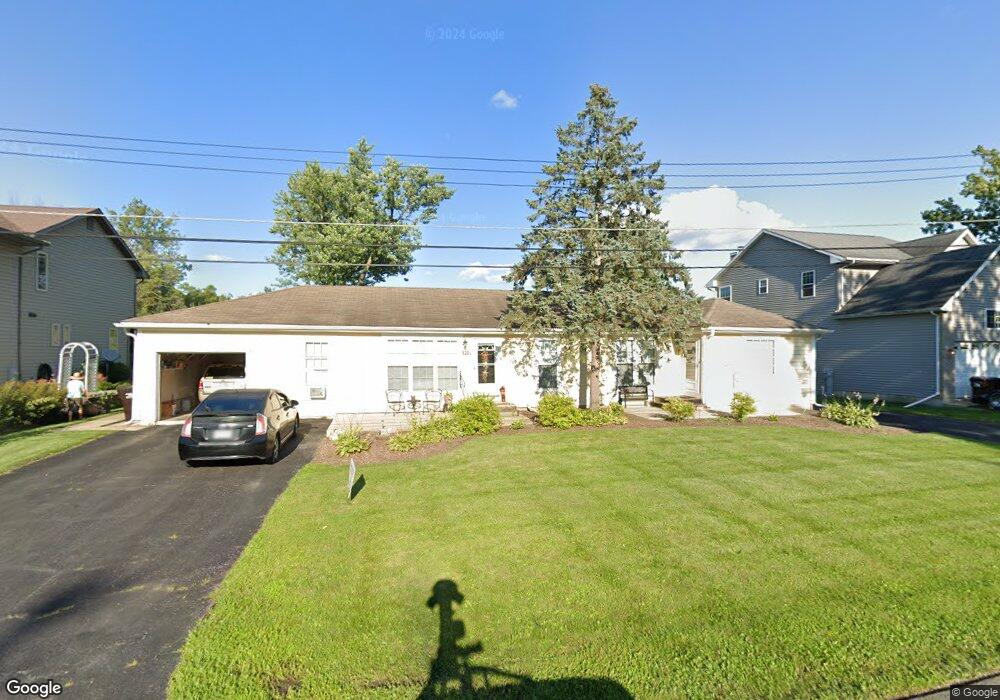
928 Jackson Ave Wauconda, IL 60084
Estimated Value: $377,966 - $657,000
Studio
2
Baths
1,920
Sq Ft
$255/Sq Ft
Est. Value
About This Home
This home is located at 928 Jackson Ave, Wauconda, IL 60084 and is currently estimated at $489,242, approximately $254 per square foot. 928 Jackson Ave is a home located in Lake County with nearby schools including Wauconda Grade School, Wauconda Middle School, and Wauconda High School.
Ownership History
Date
Name
Owned For
Owner Type
Purchase Details
Closed on
Feb 8, 2011
Sold by
Altmann Joseph A and Altmann Kathryn J
Bought by
Kelsey Properties Llc
Current Estimated Value
Purchase Details
Closed on
Oct 22, 2010
Sold by
Kelsey Properties Llc
Bought by
Altmann Jospeh A and Altmann Kathryn J
Purchase Details
Closed on
Dec 30, 2007
Sold by
Altmann Joseph A and Altmann Kathryn J
Bought by
Kelsey Properties Llc
Home Financials for this Owner
Home Financials are based on the most recent Mortgage that was taken out on this home.
Original Mortgage
$138,100
Interest Rate
6.44%
Mortgage Type
Unknown
Purchase Details
Closed on
Nov 5, 2007
Sold by
Kelsey Properties Llc
Bought by
Altmann Joseph A and Altmann Kathryn J
Home Financials for this Owner
Home Financials are based on the most recent Mortgage that was taken out on this home.
Original Mortgage
$138,100
Interest Rate
6.44%
Mortgage Type
Unknown
Purchase Details
Closed on
Mar 21, 2005
Sold by
Altmann Joseph A and Altmann Kathryn J
Bought by
Kelsey Properties Llc
Create a Home Valuation Report for This Property
The Home Valuation Report is an in-depth analysis detailing your home's value as well as a comparison with similar homes in the area
Home Values in the Area
Average Home Value in this Area
Purchase History
| Date | Buyer | Sale Price | Title Company |
|---|---|---|---|
| Kelsey Properties Llc | -- | None Available | |
| Altmann Jospeh A | -- | None Available | |
| Kelsey Properties Llc | -- | None Available | |
| Altmann Joseph A | -- | Cti | |
| Kelsey Properties Llc | -- | -- |
Source: Public Records
Mortgage History
| Date | Status | Borrower | Loan Amount |
|---|---|---|---|
| Previous Owner | Altmann Joseph A | $138,100 |
Source: Public Records
Tax History
| Year | Tax Paid | Tax Assessment Tax Assessment Total Assessment is a certain percentage of the fair market value that is determined by local assessors to be the total taxable value of land and additions on the property. | Land | Improvement |
|---|---|---|---|---|
| 2024 | $9,329 | $116,244 | $41,592 | $74,652 |
| 2023 | $8,670 | $94,942 | $38,018 | $56,924 |
| 2022 | $8,670 | $79,461 | $33,152 | $46,309 |
| 2021 | $8,311 | $75,084 | $31,326 | $43,758 |
| 2020 | $8,075 | $71,563 | $29,857 | $41,706 |
| 2019 | $7,198 | $67,634 | $28,218 | $39,416 |
| 2018 | $7,443 | $64,703 | $33,276 | $31,427 |
| 2017 | $7,440 | $63,955 | $32,891 | $31,064 |
| 2016 | $7,019 | $60,564 | $31,147 | $29,417 |
| 2015 | $6,648 | $55,599 | $28,594 | $27,005 |
| 2014 | $7,662 | $62,541 | $32,708 | $29,833 |
| 2012 | $7,414 | $65,623 | $31,292 | $34,331 |
Source: Public Records
Map
Nearby Homes
- 818 Sheridan Dr
- 1114 Jackson Ave
- 905 Grand Blvd
- 701 Lake Shore Dr
- 1017 Grand Blvd
- 0 Bonner Rd
- 1260 Water Stone Cir
- 505 Woodland Ave
- 428 Country Lane Ct Unit 301
- 28722 N Madison Ave
- 25817 W Cook St
- 417 Lake Shore Blvd
- 365 Lake Ave Unit C
- 902 Highland Ave
- 304 Hill St Unit 1004
- 28331 W Main St
- 360 Promontory Ln Unit B
- 360 Promontory Ln Unit D
- 28855 N Garland Rd
- 235 Crestview Dr Unit A
- 920 Jackson Ave
- 950 Jackson Ave
- 1000 Jackson Ave
- 918 Jackson Ave
- 1004 Jackson Ave
- 923 Jackson Ave
- 921 Jackson Ave
- 914 Jackson Ave
- 919 Jackson Ave
- 821 Northshore Dr
- 917 Jackson Ave
- 930 Adams St
- 913 Jackson Ave
- 930 Adams Ave
- 924 Adams St
- 920 Adams St
- 910 Jackson Ave
- 817 Northshore Dr
- 916 Adams St
- 815 Northshore Dr
Your Personal Tour Guide
Ask me questions while you tour the home.