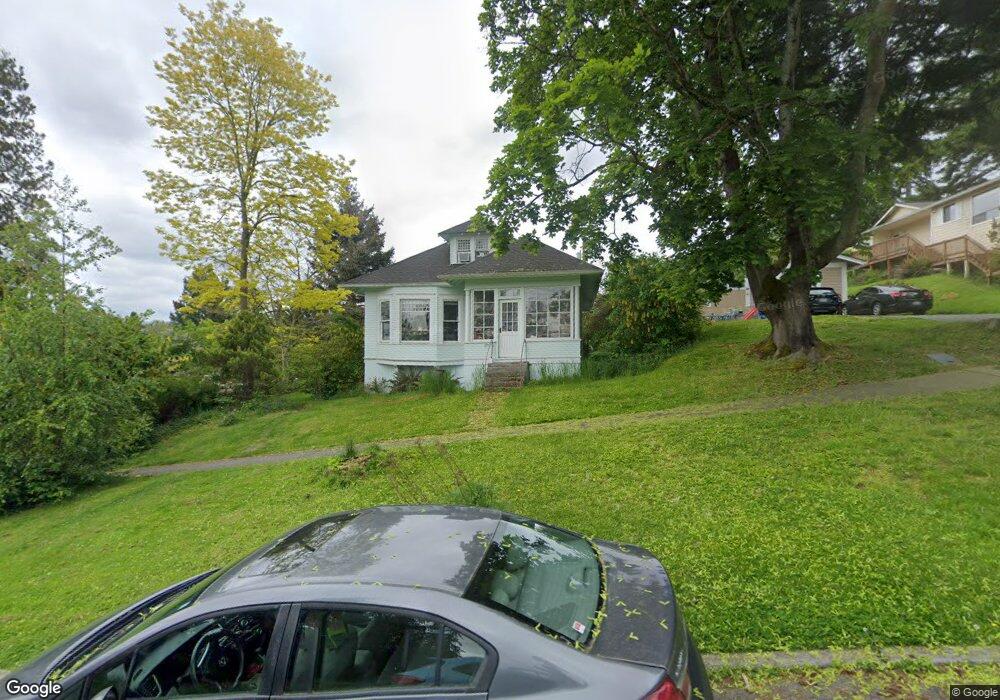
928 Key St Bellingham, WA 98225
Sehome NeighborhoodEstimated Value: $713,000 - $766,000
5
Beds
2
Baths
1,854
Sq Ft
$398/Sq Ft
Est. Value
About This Home
This home is located at 928 Key St, Bellingham, WA 98225 and is currently estimated at $737,780, approximately $397 per square foot. 928 Key St is a home located in Whatcom County with nearby schools including Happy Valley Elementary School, Fairhaven Middle School, and Sehome High School.
Ownership History
Date
Name
Owned For
Owner Type
Purchase Details
Closed on
Feb 16, 2023
Sold by
Robinson Walter L
Bought by
Robinson Walter L and Elton Sharon L
Current Estimated Value
Create a Home Valuation Report for This Property
The Home Valuation Report is an in-depth analysis detailing your home's value as well as a comparison with similar homes in the area
Home Values in the Area
Average Home Value in this Area
Purchase History
| Date | Buyer | Sale Price | Title Company |
|---|---|---|---|
| Robinson Walter L | -- | -- |
Source: Public Records
Tax History
| Year | Tax Paid | Tax Assessment Tax Assessment Total Assessment is a certain percentage of the fair market value that is determined by local assessors to be the total taxable value of land and additions on the property. | Land | Improvement |
|---|---|---|---|---|
| 2025 | $5,175 | $651,153 | $327,680 | $323,473 |
| 2024 | $5,045 | $632,195 | $318,140 | $314,055 |
| 2023 | $5,045 | $648,291 | $326,240 | $322,051 |
| 2022 | $3,987 | $549,410 | $276,480 | $272,930 |
| 2021 | $3,911 | $429,227 | $216,000 | $213,227 |
| 2020 | $3,653 | $397,432 | $200,000 | $197,432 |
| 2019 | $3,442 | $358,773 | $203,500 | $155,273 |
| 2018 | $3,466 | $338,902 | $192,308 | $146,594 |
| 2017 | $3,017 | $291,756 | $165,275 | $126,481 |
| 2016 | $2,705 | $265,458 | $150,288 | $115,170 |
| 2015 | $2,712 | $247,781 | $141,763 | $106,018 |
| 2014 | -- | $240,330 | $137,500 | $102,830 |
| 2013 | -- | $224,882 | $132,750 | $92,132 |
Source: Public Records
Map
Nearby Homes
- 1028 Billy Frank Jr St Unit 301
- 1205 E Maple St
- 924 N Garden St Unit 201
- 819 High St Unit 101
- 819 High St Unit 317
- 826 N Garden St
- 119 N Samish Way Unit 30
- 1126 N Forest St
- 901 N Forest St Unit 123
- 901 N Forest St Unit 109
- 715 N Garden St Unit 502
- 820 N State St Unit 520
- 820 N State St Unit 505
- 820 N State St Unit 521
- 820 N State St Unit 513
- 310 E Ivy St
- 1001 N State St Unit 209
- 1031 N State St Unit 107
- 125 S 34th St
- 0 Byron Ave
Your Personal Tour Guide
Ask me questions while you tour the home.