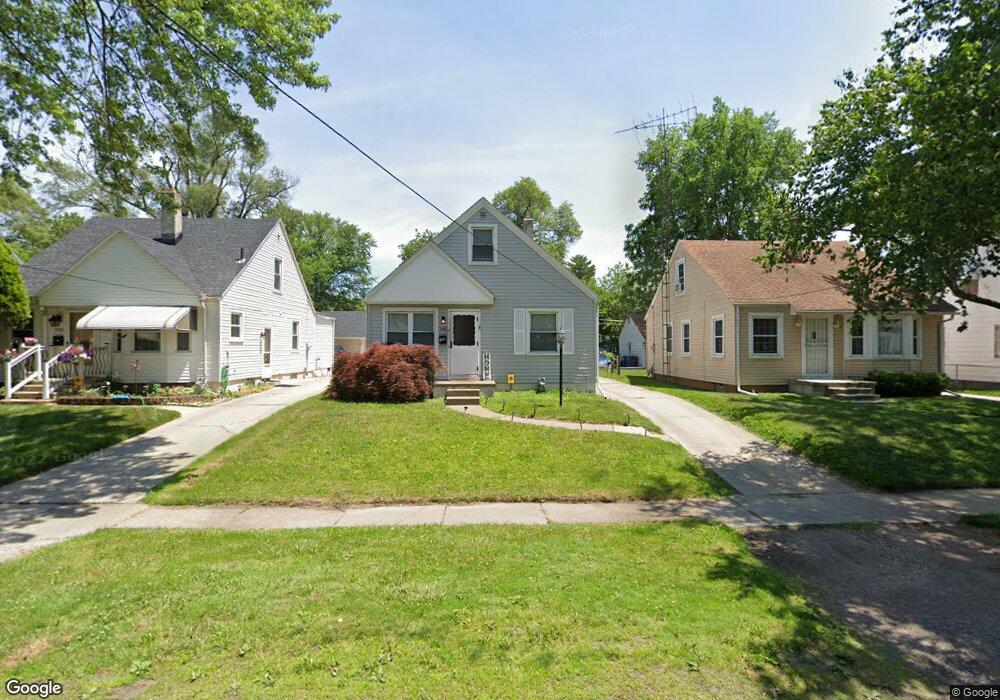
928 MacKow Dr Toledo, OH 43607
Scott Park NeighborhoodEstimated Value: $92,000 - $126,000
3
Beds
1
Bath
1,080
Sq Ft
$99/Sq Ft
Est. Value
About This Home
This home is located at 928 MacKow Dr, Toledo, OH 43607 and is currently estimated at $106,729, approximately $98 per square foot. 928 MacKow Dr is a home located in Lucas County with nearby schools including Keyser Elementary School, Rogers High School, and Victory Academy of Toledo.
Ownership History
Date
Name
Owned For
Owner Type
Purchase Details
Closed on
Oct 22, 2021
Sold by
Ham Investments Llc
Bought by
Zebbadji Tim
Current Estimated Value
Purchase Details
Closed on
Dec 10, 2015
Sold by
Mhs Investments Llc
Bought by
Ham Investments Llc
Purchase Details
Closed on
Aug 25, 2011
Sold by
Stubbs Michael C and Stubbs Heather E
Bought by
Mhs Investments Llc
Purchase Details
Closed on
May 19, 2008
Sold by
Citifinancial Mortgage Co Inc
Bought by
Stubbs Michael C
Purchase Details
Closed on
Jan 25, 2008
Sold by
Brazzel Patricia A
Bought by
Citifinancial Mortgage Co Inc and Associates Home Equity Services Inc
Purchase Details
Closed on
Aug 18, 1994
Sold by
Krall Anthony M
Bought by
Brazzel Patricia A
Home Financials for this Owner
Home Financials are based on the most recent Mortgage that was taken out on this home.
Original Mortgage
$44,550
Interest Rate
8.73%
Mortgage Type
New Conventional
Create a Home Valuation Report for This Property
The Home Valuation Report is an in-depth analysis detailing your home's value as well as a comparison with similar homes in the area
Home Values in the Area
Average Home Value in this Area
Purchase History
| Date | Buyer | Sale Price | Title Company |
|---|---|---|---|
| Zebbadji Tim | $15,000 | None Available | |
| Ham Investments Llc | -- | None Available | |
| Mhs Investments Llc | -- | None Available | |
| Stubbs Michael C | $19,900 | None Available | |
| Citifinancial Mortgage Co Inc | $40,000 | None Available | |
| Brazzel Patricia A | $46,900 | -- |
Source: Public Records
Mortgage History
| Date | Status | Borrower | Loan Amount |
|---|---|---|---|
| Previous Owner | Brazzel Patricia A | $44,550 |
Source: Public Records
Tax History Compared to Growth
Tax History
| Year | Tax Paid | Tax Assessment Tax Assessment Total Assessment is a certain percentage of the fair market value that is determined by local assessors to be the total taxable value of land and additions on the property. | Land | Improvement |
|---|---|---|---|---|
| 2024 | $663 | $20,195 | $5,215 | $14,980 |
| 2023 | $1,146 | $16,450 | $3,255 | $13,195 |
| 2022 | $1,135 | $16,450 | $3,255 | $13,195 |
| 2021 | $1,174 | $16,450 | $3,255 | $13,195 |
| 2020 | $1,271 | $15,750 | $3,080 | $12,670 |
| 2019 | $1,229 | $15,750 | $3,080 | $12,670 |
| 2018 | $1,248 | $15,750 | $3,080 | $12,670 |
| 2017 | $1,247 | $15,400 | $3,010 | $12,390 |
| 2016 | $1,254 | $44,000 | $8,600 | $35,400 |
| 2015 | $1,262 | $44,000 | $8,600 | $35,400 |
| 2014 | $995 | $15,400 | $3,010 | $12,390 |
| 2013 | $995 | $15,400 | $3,010 | $12,390 |
Source: Public Records
Map
Nearby Homes
- 826 Ranch Dr
- 1117 Broer Ave
- 914 Turner Ave
- 1125 Secor Rd
- 615 Cuthbert Rd
- 2013 Bretton Place
- 1408 Roosevelt Ave
- 3205 Kylemore Rd
- 3155 Kylemore Rd
- 514 Conrad Ave
- 2666 Montebello Rd
- 735 Southbriar Rd
- 3825 Whitegate Dr
- 2003 Farnham Rd
- 1752 Pilgrim Rd
- 3305 W Bancroft St
- 1809 Pilgrim Rd
- 3614 Edgevale Rd
- 1702 Alvin St
- 1911 Kensington Rd
- 924 MacKow Dr
- 932 MacKow Dr
- 920 MacKow Dr
- 1002 MacKow Dr
- 916 MacKow Dr
- 1006 MacKow Dr
- 927 Underwood Ave
- 931 Underwood Ave
- 921 Underwood Ave
- 1010 MacKow Dr
- 917 Underwood Ave
- 1009 Underwood Ave
- 927 MacKow Dr
- 931 MacKow Dr
- 908 MacKow Dr
- 1014 MacKow Dr
- 923 MacKow Dr
- 1001 MacKow Dr
- 909 Underwood Ave
- 919 MacKow Dr