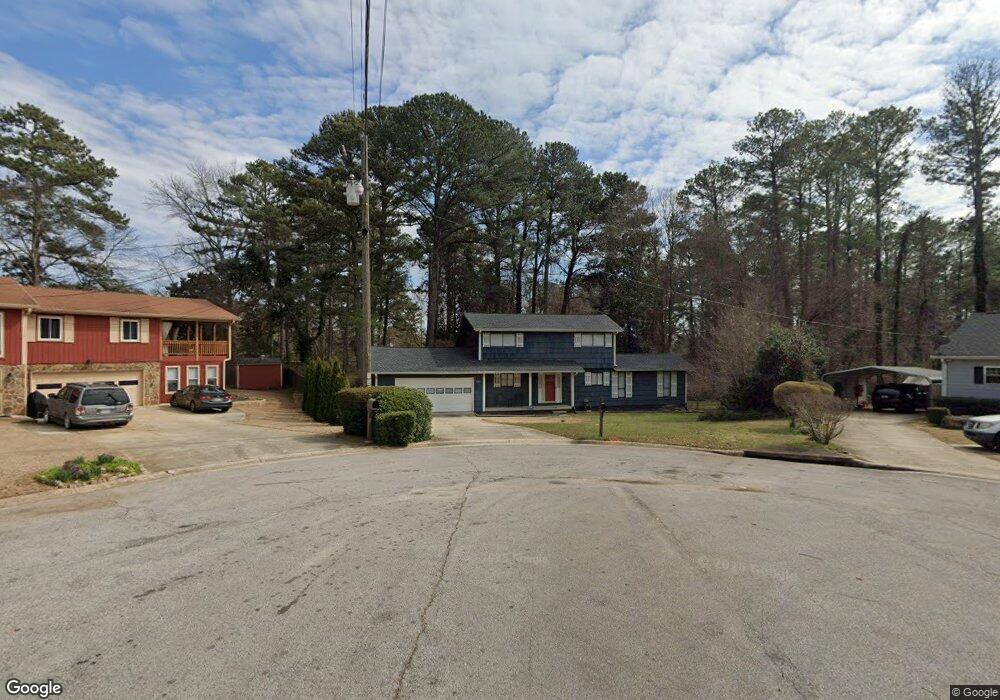
928 Mulberry Ct Ellenwood, GA 30294
Estimated Value: $257,743 - $299,000
3
Beds
3
Baths
2,025
Sq Ft
$135/Sq Ft
Est. Value
About This Home
This home is located at 928 Mulberry Ct, Ellenwood, GA 30294 and is currently estimated at $272,686, approximately $134 per square foot. 928 Mulberry Ct is a home located in Henry County with nearby schools including Fairview Elementary School, Austin Road Middle School, and Stockbridge High School.
Ownership History
Date
Name
Owned For
Owner Type
Purchase Details
Closed on
Apr 10, 2017
Sold by
Drd Holdings Llc
Bought by
Whitaker William Brent
Current Estimated Value
Home Financials for this Owner
Home Financials are based on the most recent Mortgage that was taken out on this home.
Original Mortgage
$128,627
Outstanding Balance
$107,628
Interest Rate
4.5%
Mortgage Type
FHA
Estimated Equity
$165,058
Purchase Details
Closed on
Jan 4, 2012
Sold by
Patel Rupal
Bought by
Drd Holdings Llc
Purchase Details
Closed on
Sep 15, 2005
Sold by
United Capital Of North Georgia Inc
Bought by
Patel Rupal H
Purchase Details
Closed on
Feb 1, 2005
Sold by
Bank America Na
Bought by
Hud
Purchase Details
Closed on
Oct 7, 1998
Sold by
End Run Development Inc
Bought by
Hicks Edward and Hicks Laverne
Home Financials for this Owner
Home Financials are based on the most recent Mortgage that was taken out on this home.
Original Mortgage
$101,600
Interest Rate
6.47%
Mortgage Type
FHA
Purchase Details
Closed on
Feb 2, 1998
Sold by
Sharpe Gussie Cornelia
Bought by
End Run Development Inc
Home Financials for this Owner
Home Financials are based on the most recent Mortgage that was taken out on this home.
Original Mortgage
$82,400
Interest Rate
7.01%
Mortgage Type
New Conventional
Create a Home Valuation Report for This Property
The Home Valuation Report is an in-depth analysis detailing your home's value as well as a comparison with similar homes in the area
Home Values in the Area
Average Home Value in this Area
Purchase History
| Date | Buyer | Sale Price | Title Company |
|---|---|---|---|
| Whitaker William Brent | $131,000 | -- | |
| Drd Holdings Llc | $32,320 | -- | |
| Patel Rupal H | $99,000 | -- | |
| Hud | -- | -- | |
| Bank Of America Na | $110,149 | -- | |
| Hicks Edward | $103,000 | -- | |
| End Run Development Inc | $80,000 | -- |
Source: Public Records
Mortgage History
| Date | Status | Borrower | Loan Amount |
|---|---|---|---|
| Open | Whitaker William Brent | $128,627 | |
| Previous Owner | Hicks Edward | $101,600 | |
| Previous Owner | End Run Development Inc | $82,400 |
Source: Public Records
Tax History Compared to Growth
Tax History
| Year | Tax Paid | Tax Assessment Tax Assessment Total Assessment is a certain percentage of the fair market value that is determined by local assessors to be the total taxable value of land and additions on the property. | Land | Improvement |
|---|---|---|---|---|
| 2025 | $2,783 | $104,480 | $14,000 | $90,480 |
| 2024 | $2,783 | $99,120 | $14,000 | $85,120 |
| 2023 | $2,402 | $105,320 | $14,000 | $91,320 |
| 2022 | $2,421 | $84,760 | $10,000 | $74,760 |
| 2021 | $2,044 | $68,800 | $10,000 | $58,800 |
| 2020 | $1,884 | $62,040 | $6,000 | $56,040 |
| 2019 | $1,757 | $56,680 | $6,000 | $50,680 |
| 2018 | $1,656 | $52,400 | $5,974 | $46,426 |
| 2016 | $1,328 | $39,520 | $6,000 | $33,520 |
| 2015 | $1,263 | $30,920 | $4,800 | $26,120 |
| 2014 | $1,044 | $25,080 | $4,800 | $20,280 |
Source: Public Records
Map
Nearby Homes
- 963 Blackberry Ct
- 907 Strawberry Ct
- 1414 Panola Rd
- 322 Acaro Ct
- 565 Scarborough Rd
- 20 Fairfield Dr Unit 2
- 60 Victoria Dr
- 270 Huckleberry Ln
- 4923 Amsler Rd
- 115 Elizabeth Way
- 500 Saint Sambar Dr
- 130 Gabion Loop
- 4934 Brookstone Pkwy
- 209 Kingscastle Dr
- 429 Saint Surrey Way
- 0 Kingsbrook Dr Unit 19 LOTS 10399843
- 4864 Brookstone Pkwy
- 133 Northtowne Cove
- 103 N Circle Dr
- 5125 Flakes Mill Rd
- 925 Mulberry Ct
- 924 Mulberry Ct
- 142 Overlook Ct
- 181 Hill Ln
- 179 Hill Ln Unit 5
- 921 Mulberry Ct
- 920 Mulberry Ct
- 146 Overlook Ct
- 138 Overlook Ct
- 916 Mulberry Ct
- 1070 Strawberry Ln
- 1060 Strawberry Ln Unit A/16
- 1060 Strawberry Ln
- 0 Mulberry Ct Unit 8297004
- 0 Mulberry Ct Unit 8064208
- 1074 Strawberry Ln
- 175 Hill Ln
- 183 Hill Ln Unit 5
- 134 Overlook Ct
- 160 Deer Run Rd