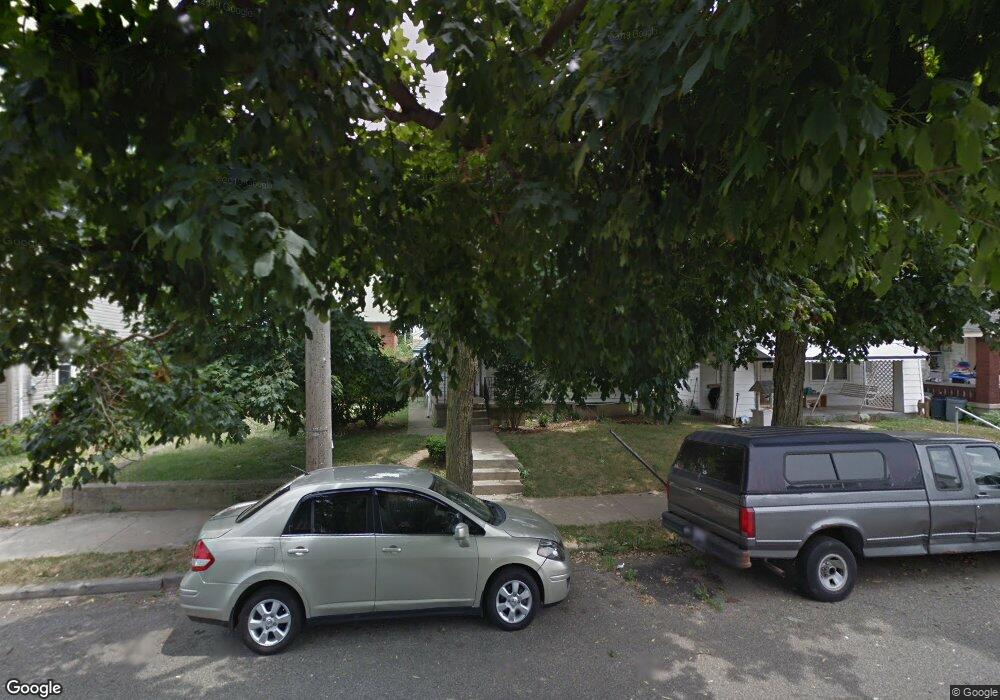
928 S 11th St Hamilton, OH 45011
East Hamilton NeighborhoodEstimated Value: $73,000 - $86,000
2
Beds
1
Bath
916
Sq Ft
$85/Sq Ft
Est. Value
About This Home
This home is located at 928 S 11th St, Hamilton, OH 45011 and is currently estimated at $78,103, approximately $85 per square foot. 928 S 11th St is a home located in Butler County with nearby schools including Riverview Elementary School, Garfield Middle School, and Hamilton Freshman School.
Ownership History
Date
Name
Owned For
Owner Type
Purchase Details
Closed on
Nov 22, 2024
Sold by
Fox Kevin and Fox Anne
Bought by
Hernandez Judith Ramirez
Current Estimated Value
Purchase Details
Closed on
Aug 19, 2008
Sold by
Gmac Mortgage Llc
Bought by
Fox Kevin
Purchase Details
Closed on
Mar 5, 2008
Sold by
Robinson Tisha
Bought by
Gmac Mortgage Llc
Purchase Details
Closed on
Mar 3, 2005
Sold by
Jackson Dorothy M
Bought by
Robinson Gary W
Home Financials for this Owner
Home Financials are based on the most recent Mortgage that was taken out on this home.
Original Mortgage
$52,650
Interest Rate
8%
Mortgage Type
Purchase Money Mortgage
Create a Home Valuation Report for This Property
The Home Valuation Report is an in-depth analysis detailing your home's value as well as a comparison with similar homes in the area
Home Values in the Area
Average Home Value in this Area
Purchase History
| Date | Buyer | Sale Price | Title Company |
|---|---|---|---|
| Hernandez Judith Ramirez | $75,000 | None Listed On Document | |
| Hernandez Judith Ramirez | $75,000 | None Listed On Document | |
| Fox Kevin | $16,500 | Resource Title Of Cincinnati | |
| Gmac Mortgage Llc | $36,000 | None Available | |
| Robinson Gary W | $58,200 | -- |
Source: Public Records
Mortgage History
| Date | Status | Borrower | Loan Amount |
|---|---|---|---|
| Previous Owner | Robinson Gary W | $52,650 |
Source: Public Records
Tax History Compared to Growth
Tax History
| Year | Tax Paid | Tax Assessment Tax Assessment Total Assessment is a certain percentage of the fair market value that is determined by local assessors to be the total taxable value of land and additions on the property. | Land | Improvement |
|---|---|---|---|---|
| 2024 | $488 | $11,240 | $880 | $10,360 |
| 2023 | $482 | $11,240 | $880 | $10,360 |
| 2022 | $461 | $9,000 | $880 | $8,120 |
| 2021 | $402 | $8,660 | $880 | $7,780 |
| 2020 | $418 | $8,660 | $880 | $7,780 |
| 2019 | $532 | $7,260 | $920 | $6,340 |
| 2018 | $347 | $7,260 | $920 | $6,340 |
| 2017 | $350 | $7,260 | $920 | $6,340 |
| 2016 | $352 | $6,960 | $920 | $6,040 |
| 2015 | $341 | $6,960 | $920 | $6,040 |
| 2014 | $275 | $6,960 | $920 | $6,040 |
| 2013 | $275 | $5,780 | $1,160 | $4,620 |
Source: Public Records
Map
Nearby Homes
- 1108 Grand Blvd
- 1121 Grand Blvd
- 927 Harmon Ave
- 1317 Bonacker Ave
- 720 S 9th St
- 1512 Pleasant Ave
- 1114 Chestnut St
- 1232 Chestnut St
- 1129 Kahn Ave
- 1136 Kahn Ave
- 1237 Lane St
- 1931 Logan Ave
- 1620 Shuler Ave
- 1226 Clearview Place
- 1841 Pleasant Ave
- 603 Sycamore St
- 316 Washington St
- 632 Schenck Ave
- 264 Washington St
- 135 Linda Ln