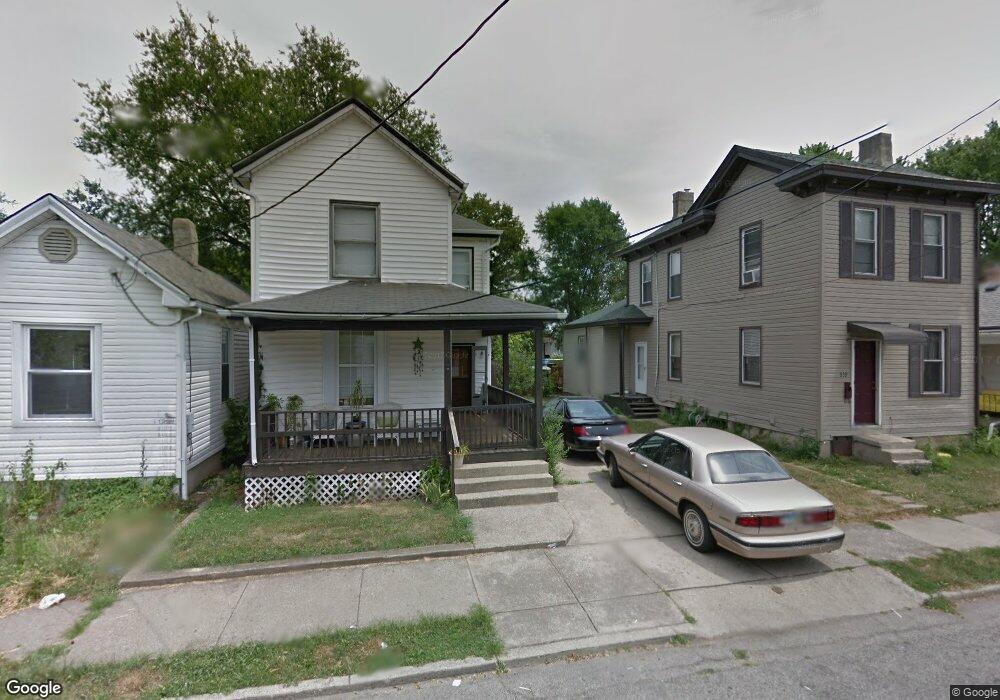
928 S 12th St Hamilton, OH 45011
East Hamilton NeighborhoodEstimated Value: $102,000 - $128,000
3
Beds
1
Bath
1,838
Sq Ft
$63/Sq Ft
Est. Value
About This Home
This home is located at 928 S 12th St, Hamilton, OH 45011 and is currently estimated at $115,140, approximately $62 per square foot. 928 S 12th St is a home located in Butler County with nearby schools including Fairwood Elementary School, Garfield Middle School, and Hamilton Freshman School.
Ownership History
Date
Name
Owned For
Owner Type
Purchase Details
Closed on
Aug 15, 2025
Sold by
Vintage Homes Of Ohio Ltd
Bought by
Ramos Ruben Diaz and Carreno Lucila Avendano
Current Estimated Value
Purchase Details
Closed on
Jun 8, 2011
Sold by
Packo Stephen J and Packo Glenda
Bought by
Vintage Homes Of Ohio Ltd
Purchase Details
Closed on
Jul 21, 2009
Sold by
Dryden Properties Inc
Bought by
Packo Stephen J
Purchase Details
Closed on
May 19, 2006
Sold by
Hud
Bought by
Vhb Properties Inc
Purchase Details
Closed on
May 19, 2005
Sold by
Ceo Carl R
Bought by
Hud
Purchase Details
Closed on
Aug 9, 2001
Sold by
Brown Rocky R and Brown Marlene R
Bought by
Ceo Carl R and Ceo Frances F
Home Financials for this Owner
Home Financials are based on the most recent Mortgage that was taken out on this home.
Original Mortgage
$53,490
Interest Rate
7.06%
Mortgage Type
Purchase Money Mortgage
Purchase Details
Closed on
Feb 23, 1994
Purchase Details
Closed on
Aug 1, 1988
Create a Home Valuation Report for This Property
The Home Valuation Report is an in-depth analysis detailing your home's value as well as a comparison with similar homes in the area
Home Values in the Area
Average Home Value in this Area
Purchase History
| Date | Buyer | Sale Price | Title Company |
|---|---|---|---|
| Ramos Ruben Diaz | -- | None Listed On Document | |
| Vintage Homes Of Ohio Ltd | -- | Attorney | |
| Packo Stephen J | $65,000 | Attorney | |
| Dryden Properties Inc | $50,000 | Attorney | |
| Vhb Properties Inc | $14,000 | Lakeside Title & Escrow Agen | |
| Hud | $29,000 | -- | |
| Ceo Carl R | $62,000 | First Title Agency Inc | |
| -- | $33,000 | -- | |
| -- | $18,000 | -- |
Source: Public Records
Mortgage History
| Date | Status | Borrower | Loan Amount |
|---|---|---|---|
| Previous Owner | Ceo Carl R | $53,490 |
Source: Public Records
Tax History
| Year | Tax Paid | Tax Assessment Tax Assessment Total Assessment is a certain percentage of the fair market value that is determined by local assessors to be the total taxable value of land and additions on the property. | Land | Improvement |
|---|---|---|---|---|
| 2025 | $1,146 | $16,290 | $990 | $15,300 |
| 2024 | $1,146 | $16,290 | $990 | $15,300 |
| 2023 | $725 | $16,290 | $990 | $15,300 |
| 2022 | $1,406 | $12,610 | $990 | $11,620 |
| 2021 | $586 | $12,120 | $990 | $11,130 |
| 2020 | $610 | $12,120 | $990 | $11,130 |
| 2019 | $718 | $9,810 | $1,010 | $8,800 |
| 2018 | $492 | $9,810 | $1,010 | $8,800 |
| 2017 | $496 | $9,810 | $1,010 | $8,800 |
| 2016 | $495 | $9,330 | $1,010 | $8,320 |
| 2015 | $470 | $9,330 | $1,010 | $8,320 |
| 2014 | $3,757 | $9,330 | $1,010 | $8,320 |
| 2013 | $3,757 | $16,580 | $3,430 | $13,150 |
Source: Public Records
Map
Nearby Homes
- 1612 Irma Ave
- 1129 Grand Blvd
- 1108 Bonacker Ave
- 1317 Bonacker Ave
- 1555 S 12th St
- 1232 Chestnut St
- 1114 Chestnut St
- 1512 Pleasant Ave
- 1935 Howell Ave
- 1661 Ray Combs Ave
- 325 S 11th St
- 4890 Harrier Ln
- 1836 Pleasant Ave
- 302 S 7th St
- 334 Hanover St
- 1431 Parkamo Ave
- 603 Sycamore St
- 712 S 4th St
- 1836 Shuler Ave
- 2024 Logan Ave
Your Personal Tour Guide
Ask me questions while you tour the home.