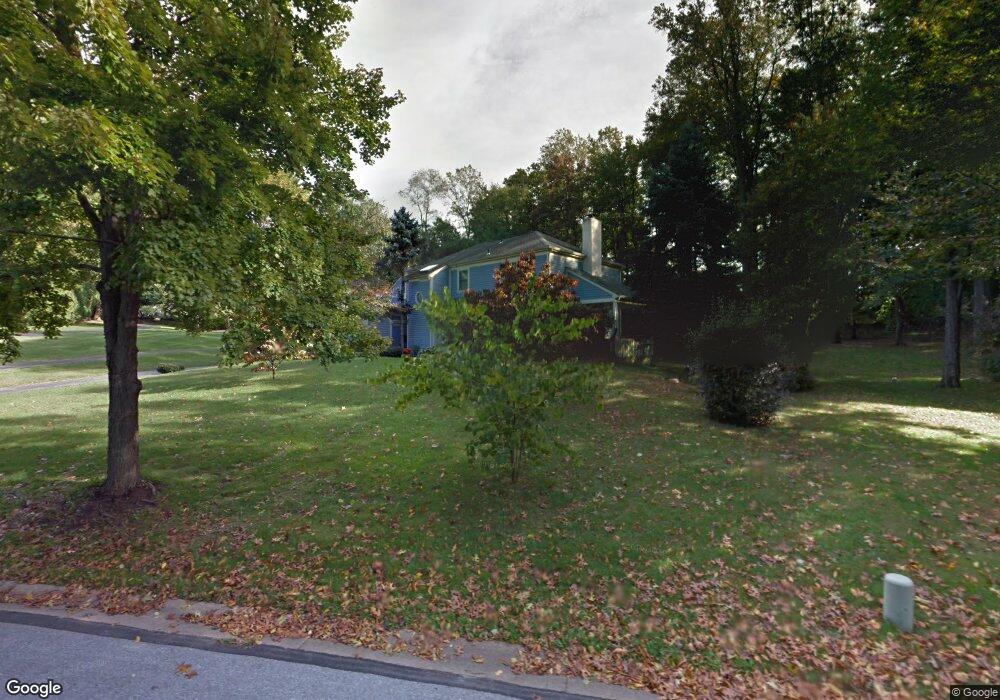
928 Saint Andrews Dr Malvern, PA 19355
Estimated Value: $807,000 - $881,000
3
Beds
3
Baths
2,527
Sq Ft
$327/Sq Ft
Est. Value
About This Home
This home is located at 928 Saint Andrews Dr, Malvern, PA 19355 and is currently estimated at $826,167, approximately $326 per square foot. 928 Saint Andrews Dr is a home located in Chester County with nearby schools including East Goshen Elementary School, J.R. Fugett Middle School, and West Chester East High School.
Ownership History
Date
Name
Owned For
Owner Type
Purchase Details
Closed on
Jan 2, 2003
Sold by
Johnson Jeffrey M and Johnson Claire C
Bought by
Traylor Morgan and Traylor Amy
Current Estimated Value
Home Financials for this Owner
Home Financials are based on the most recent Mortgage that was taken out on this home.
Original Mortgage
$280,500
Outstanding Balance
$121,059
Interest Rate
6.18%
Estimated Equity
$705,108
Purchase Details
Closed on
May 21, 1999
Sold by
Mehley Richard A
Bought by
Johnson Jeffrey M and Johnson Claire C
Home Financials for this Owner
Home Financials are based on the most recent Mortgage that was taken out on this home.
Original Mortgage
$176,500
Interest Rate
6.82%
Purchase Details
Closed on
Jun 30, 1995
Sold by
Paulson Gregory D and Paulson Linda J
Bought by
Mehley Richard A
Home Financials for this Owner
Home Financials are based on the most recent Mortgage that was taken out on this home.
Original Mortgage
$183,350
Interest Rate
7.37%
Create a Home Valuation Report for This Property
The Home Valuation Report is an in-depth analysis detailing your home's value as well as a comparison with similar homes in the area
Home Values in the Area
Average Home Value in this Area
Purchase History
| Date | Buyer | Sale Price | Title Company |
|---|---|---|---|
| Traylor Morgan | $330,000 | -- | |
| Johnson Jeffrey M | $256,500 | -- | |
| Mehley Richard A | $193,000 | -- |
Source: Public Records
Mortgage History
| Date | Status | Borrower | Loan Amount |
|---|---|---|---|
| Open | Traylor Morgan | $280,500 | |
| Previous Owner | Johnson Jeffrey M | $176,500 | |
| Previous Owner | Mehley Richard A | $183,350 |
Source: Public Records
Tax History Compared to Growth
Tax History
| Year | Tax Paid | Tax Assessment Tax Assessment Total Assessment is a certain percentage of the fair market value that is determined by local assessors to be the total taxable value of land and additions on the property. | Land | Improvement |
|---|---|---|---|---|
| 2025 | $6,706 | $233,350 | $52,050 | $181,300 |
| 2024 | $6,706 | $233,350 | $52,050 | $181,300 |
| 2023 | $6,706 | $233,350 | $52,050 | $181,300 |
| 2022 | $6,501 | $233,350 | $52,050 | $181,300 |
| 2021 | $6,409 | $233,350 | $52,050 | $181,300 |
| 2020 | $6,366 | $233,350 | $52,050 | $181,300 |
| 2019 | $6,275 | $233,350 | $52,050 | $181,300 |
| 2018 | $5,972 | $227,040 | $52,050 | $174,990 |
| 2017 | $5,839 | $227,040 | $52,050 | $174,990 |
| 2016 | $4,362 | $227,040 | $52,050 | $174,990 |
| 2015 | $4,362 | $227,040 | $52,050 | $174,990 |
| 2014 | $4,362 | $227,040 | $52,050 | $174,990 |
Source: Public Records
Map
Nearby Homes
- 37 Ruth Cir
- 110 Rossmore Dr
- 1060 W King Rd
- 141 Chandler Dr
- THE GREENBRIAR - Cir
- THE DELCHESTER- Millstone Circle (Gps 1010 Hershey Mill Rd)
- THE PRESCOTT - (1010 Hershey Mill Rd) -*Millstone Cir
- THE WARREN - (1010 Hershey Mill Rd )- *Millstone Cir
- 71 Rosemont Ave
- 792 Jefferson Way
- 52 Carol Ln
- 74 Sproul Rd
- 72 Sproul Rd
- 254 Chatham Way
- 0000 NOBLE Modern Farmhouse Model
- 1243 Princeton Ln
- 629 Glenwood Ln
- 856 Jefferson Way
- 201 Chandler Dr
- 305 Old Kingfisher Ln
- 926 Saint Andrews Dr
- 930 Saint Andrews Dr
- 1220 Mayapple Ln
- 924 Saint Andrews Dr
- 932 Saint Andrews Dr
- 922 Saint Andrews Dr
- 921 Saint Andrews Dr
- 919 Saint Andrews Dr
- 1221 Mayapple Ln
- 1218 Mayapple Ln
- 920 Saint Andrews Dr
- 923 Saint Andrews Dr
- 934 Saint Andrews Dr
- 1219 Mayapple Ln
- 917 Saint Andrews Dr
- 918 Saint Andrews Dr
- 1216 Mayapple Ln
- 1217 Candytuft Ln
- 925 Saint Andrews Dr
- 1219 Candytuft Ln