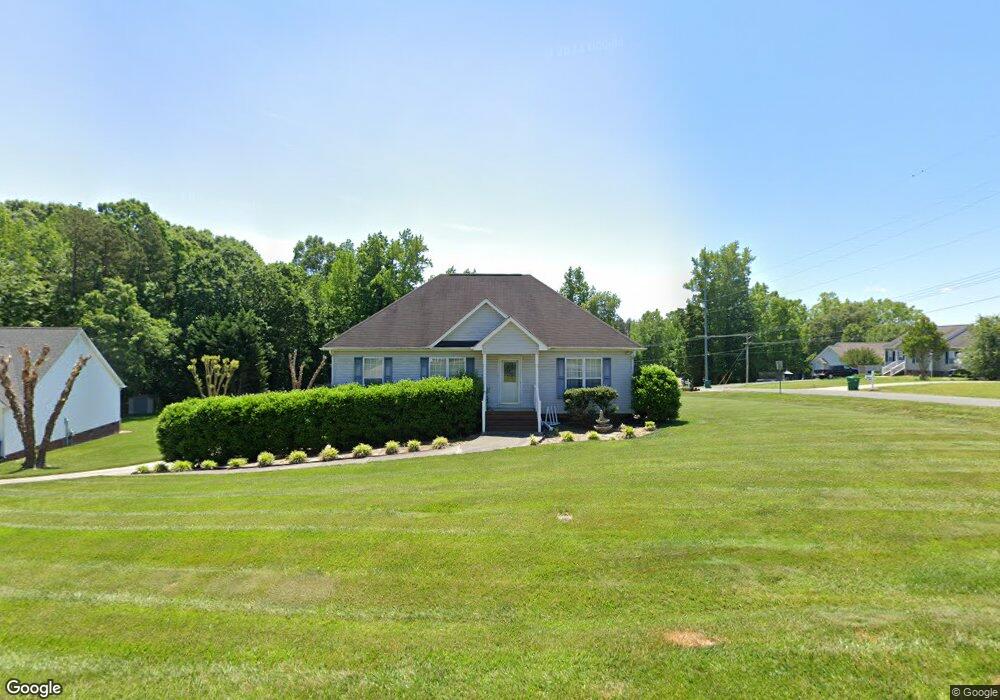
928 Star Mill Rd Stanfield, NC 28163
Estimated Value: $280,454 - $350,000
3
Beds
2
Baths
1,276
Sq Ft
$247/Sq Ft
Est. Value
About This Home
This home is located at 928 Star Mill Rd, Stanfield, NC 28163 and is currently estimated at $315,364, approximately $247 per square foot. 928 Star Mill Rd is a home located in Stanly County with nearby schools including Locust Elementary School, West Stanly Middle School, and West Stanly High School.
Ownership History
Date
Name
Owned For
Owner Type
Purchase Details
Closed on
Jan 1, 2011
Bought by
Hartsell Jimmie D
Current Estimated Value
Purchase Details
Closed on
Mar 15, 2010
Sold by
Hartsell Jimmie D and Hartsell Stephanie R
Bought by
Hartsell Jimmie D
Purchase Details
Closed on
Sep 14, 2007
Sold by
Eudy Jerry L and Eudy Kari L
Bought by
Hartsell Jimmie D and Hartsell Stephanie R
Home Financials for this Owner
Home Financials are based on the most recent Mortgage that was taken out on this home.
Original Mortgage
$149,900
Interest Rate
6.55%
Mortgage Type
New Conventional
Purchase Details
Closed on
Apr 27, 2007
Sold by
Crisco Cora Lee and Crisco Terell
Bought by
Eudy Jerry L and Bowers Kari L
Home Financials for this Owner
Home Financials are based on the most recent Mortgage that was taken out on this home.
Original Mortgage
$27,000
Interest Rate
6.12%
Mortgage Type
Future Advance Clause Open End Mortgage
Create a Home Valuation Report for This Property
The Home Valuation Report is an in-depth analysis detailing your home's value as well as a comparison with similar homes in the area
Home Values in the Area
Average Home Value in this Area
Purchase History
| Date | Buyer | Sale Price | Title Company |
|---|---|---|---|
| Hartsell Jimmie D | -- | -- | |
| Hartsell Jimmie D | -- | None Available | |
| Hartsell Jimmie D | $150,000 | None Available | |
| Eudy Jerry L | $30,000 | None Available |
Source: Public Records
Mortgage History
| Date | Status | Borrower | Loan Amount |
|---|---|---|---|
| Previous Owner | Hartsell Jimmie D | $149,900 | |
| Previous Owner | Eudy Jerry L | $27,000 |
Source: Public Records
Tax History Compared to Growth
Tax History
| Year | Tax Paid | Tax Assessment Tax Assessment Total Assessment is a certain percentage of the fair market value that is determined by local assessors to be the total taxable value of land and additions on the property. | Land | Improvement |
|---|---|---|---|---|
| 2025 | $1,891 | $199,070 | $48,160 | $150,910 |
| 2024 | $1,454 | $152,453 | $30,960 | $121,493 |
| 2023 | $1,311 | $152,453 | $30,960 | $121,493 |
| 2022 | $1,586 | $152,453 | $30,960 | $121,493 |
| 2021 | $1,570 | $152,453 | $30,960 | $121,493 |
| 2020 | $1,394 | $129,192 | $25,800 | $103,392 |
| 2019 | $1,408 | $129,192 | $25,800 | $103,392 |
| 2018 | $1,288 | $129,192 | $25,800 | $103,392 |
| 2017 | $1,408 | $129,192 | $25,800 | $103,392 |
| 2016 | $1,340 | $122,911 | $22,360 | $100,551 |
| 2015 | $1,334 | $122,911 | $22,360 | $100,551 |
| 2014 | $1,462 | $122,911 | $22,360 | $100,551 |
Source: Public Records
Map
Nearby Homes
- 931 Hollow Hill Ct
- 118 Aurora Mill Rd
- 13801 Saint Thomas Dr
- 12093 Coyle Rd
- 13768 Saint Thomas Dr
- 0 Barbee Rd
- 14004 Elm St
- 00 Griffin Greene Blvd
- 556 Big Lick Rd
- 12133 Coyle Rd
- 12069 Coyle Rd
- 7.46 Vacant Elm St
- 392 N Carolina 200
- 12613 Oak Grove Rd
- 128 Hickory Ridge Dr
- 124 Hickory Ridge Dr
- 1976 Ethan Ln
- 368 Saddlebred Ln
- 213 Streamside Dr Unit 88p
- 241 Streamside Dr Unit 76
- 936 Star Mill Rd
- 148 Aurora Mill Rd
- 155 Aurora Mill Rd
- 929 Star Mill Rd
- 165 Aurora Mill Rd
- 938 Star Mill Rd
- 140 Aurora Mill Rd
- 145 Aurora Mill Rd
- 937 Star Mill Rd
- 173 Aurora Mill Rd
- 934 Country Mill Rd
- 134 Aurora Mill Rd
- 136 Pless Mill Rd
- 136 Pless Mill Rd Unit 10
- 944 Country Mill Rd
- 146 Pless Mill Rd
- 154 Pless Mill Rd
- 181 Aurora Mill Rd
- 923 Hollow Hill Ct
- 954 Country Mill Rd