Estimated Value: $146,000 - $198,000
2
Beds
2
Baths
1,745
Sq Ft
$103/Sq Ft
Est. Value
About This Home
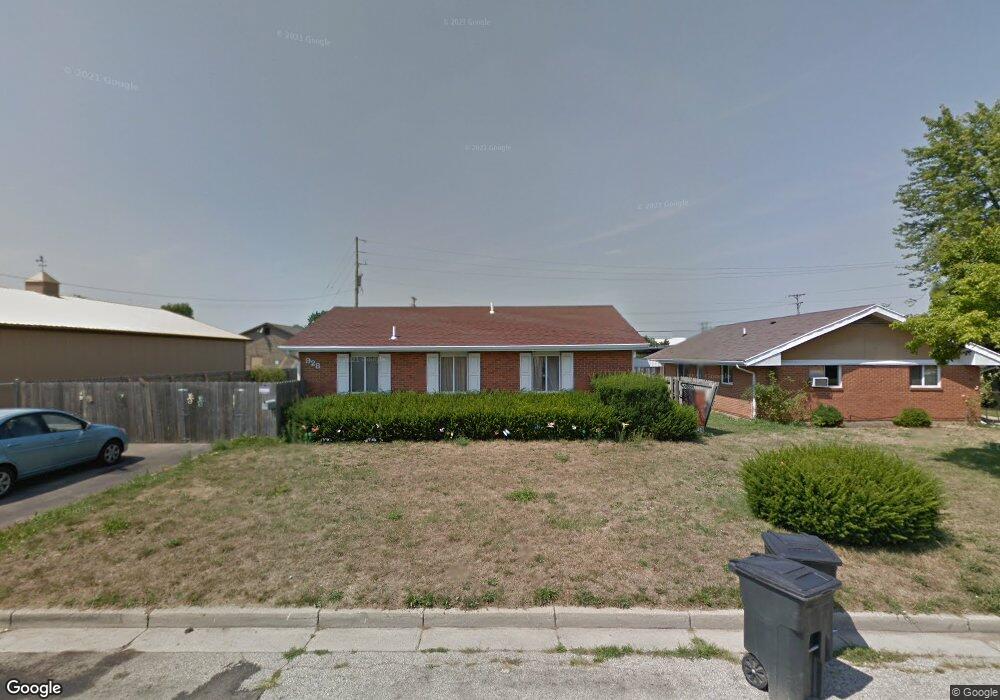
This home is located at 928 Trumbull St, Xenia, OH 45385 and is currently estimated at $179,436, approximately $102 per square foot. 928 Trumbull St is a home located in Greene County with nearby schools including Xenia High School, Summit Academy Community School for Alternative Learners - Xenia, and Legacy Christian Academy.
Ownership History
Date
Name
Owned For
Owner Type
Purchase Details
Closed on
Feb 23, 2007
Sold by
Newton Brian and Newton Jane
Bought by
Bell Margaret A
Current Estimated Value
Home Financials for this Owner
Home Financials are based on the most recent Mortgage that was taken out on this home.
Original Mortgage
$89,200
Outstanding Balance
$53,753
Interest Rate
6.27%
Mortgage Type
FHA
Estimated Equity
$125,683
Purchase Details
Closed on
Apr 24, 2003
Sold by
Newton Brian L and Newton Jane A
Bought by
Newton Brian and Newton Jane
Purchase Details
Closed on
Apr 28, 1998
Sold by
Stephenson Esther V and Jones Robert H
Bought by
Newton Brian L
Create a Home Valuation Report for This Property
The Home Valuation Report is an in-depth analysis detailing your home's value as well as a comparison with similar homes in the area
Home Values in the Area
Average Home Value in this Area
Purchase History
| Date | Buyer | Sale Price | Title Company |
|---|---|---|---|
| Bell Margaret A | $90,600 | Attorney | |
| Newton Brian | -- | -- | |
| Newton Brian L | $70,000 | -- |
Source: Public Records
Mortgage History
| Date | Status | Borrower | Loan Amount |
|---|---|---|---|
| Open | Bell Margaret A | $89,200 |
Source: Public Records
Tax History Compared to Growth
Tax History
| Year | Tax Paid | Tax Assessment Tax Assessment Total Assessment is a certain percentage of the fair market value that is determined by local assessors to be the total taxable value of land and additions on the property. | Land | Improvement |
|---|---|---|---|---|
| 2024 | $1,659 | $39,790 | $5,090 | $34,700 |
| 2023 | $1,659 | $39,790 | $5,090 | $34,700 |
| 2022 | $1,457 | $29,790 | $4,070 | $25,720 |
| 2021 | $1,515 | $29,790 | $4,070 | $25,720 |
| 2020 | $1,451 | $29,790 | $4,070 | $25,720 |
| 2019 | $947 | $18,300 | $4,660 | $13,640 |
| 2018 | $951 | $18,300 | $4,660 | $13,640 |
| 2017 | $973 | $18,300 | $4,660 | $13,640 |
| 2016 | $974 | $18,390 | $4,660 | $13,730 |
| 2015 | $976 | $18,390 | $4,660 | $13,730 |
| 2014 | $935 | $18,390 | $4,660 | $13,730 |
Source: Public Records
Map
Nearby Homes