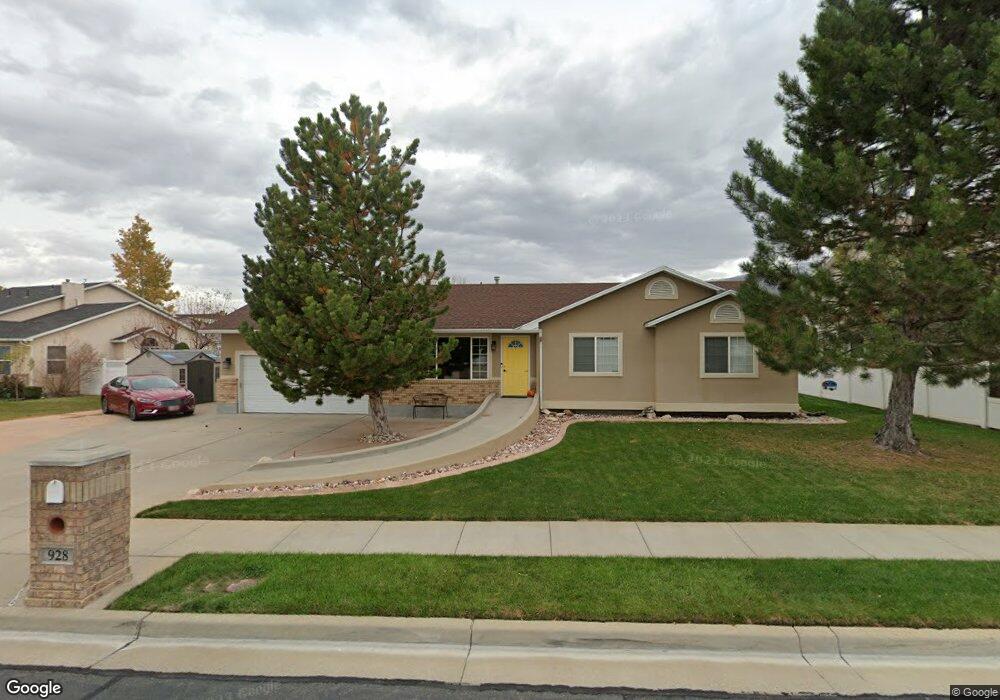
928 W 1700 N West Bountiful, UT 84087
Estimated Value: $524,000 - $576,000
3
Beds
2
Baths
1,401
Sq Ft
$394/Sq Ft
Est. Value
About This Home
This home is located at 928 W 1700 N, West Bountiful, UT 84087 and is currently estimated at $551,707, approximately $393 per square foot. 928 W 1700 N is a home located in Davis County with nearby schools including West Bountiful Elementary School, Bountiful Junior High School, and Viewmont High School.
Ownership History
Date
Name
Owned For
Owner Type
Purchase Details
Closed on
Nov 5, 1997
Sold by
J M R Construction
Bought by
Hullinger Richard D and Hullinger Marilee H
Current Estimated Value
Home Financials for this Owner
Home Financials are based on the most recent Mortgage that was taken out on this home.
Original Mortgage
$148,050
Outstanding Balance
$23,390
Interest Rate
7.26%
Estimated Equity
$528,317
Purchase Details
Closed on
Oct 16, 1996
Sold by
Sdc Wb Llc
Bought by
J M R Construction
Create a Home Valuation Report for This Property
The Home Valuation Report is an in-depth analysis detailing your home's value as well as a comparison with similar homes in the area
Home Values in the Area
Average Home Value in this Area
Purchase History
| Date | Buyer | Sale Price | Title Company |
|---|---|---|---|
| Hullinger Richard D | -- | Associated Title Company | |
| J M R Construction | -- | Associated Title Company |
Source: Public Records
Mortgage History
| Date | Status | Borrower | Loan Amount |
|---|---|---|---|
| Open | Hullinger Richard D | $148,050 |
Source: Public Records
Tax History Compared to Growth
Tax History
| Year | Tax Paid | Tax Assessment Tax Assessment Total Assessment is a certain percentage of the fair market value that is determined by local assessors to be the total taxable value of land and additions on the property. | Land | Improvement |
|---|---|---|---|---|
| 2025 | $3,095 | $261,800 | $149,671 | $112,129 |
| 2024 | $2,913 | $251,900 | $123,360 | $128,540 |
| 2023 | $2,784 | $441,000 | $231,363 | $209,637 |
| 2022 | $2,840 | $252,450 | $112,567 | $139,883 |
| 2021 | $2,567 | $349,000 | $154,851 | $194,149 |
| 2020 | $2,305 | $309,000 | $141,322 | $167,678 |
| 2019 | $2,300 | $306,000 | $140,744 | $165,256 |
| 2018 | $2,177 | $285,000 | $138,141 | $146,859 |
| 2016 | $1,911 | $136,125 | $38,920 | $97,205 |
| 2015 | $1,831 | $123,420 | $38,920 | $84,500 |
| 2014 | $1,710 | $117,793 | $38,920 | $78,873 |
| 2013 | -- | $116,288 | $46,327 | $69,961 |
Source: Public Records
Map
Nearby Homes