Estimated Value: $117,000 - $161,000
2
Beds
1
Bath
640
Sq Ft
$219/Sq Ft
Est. Value
About This Home
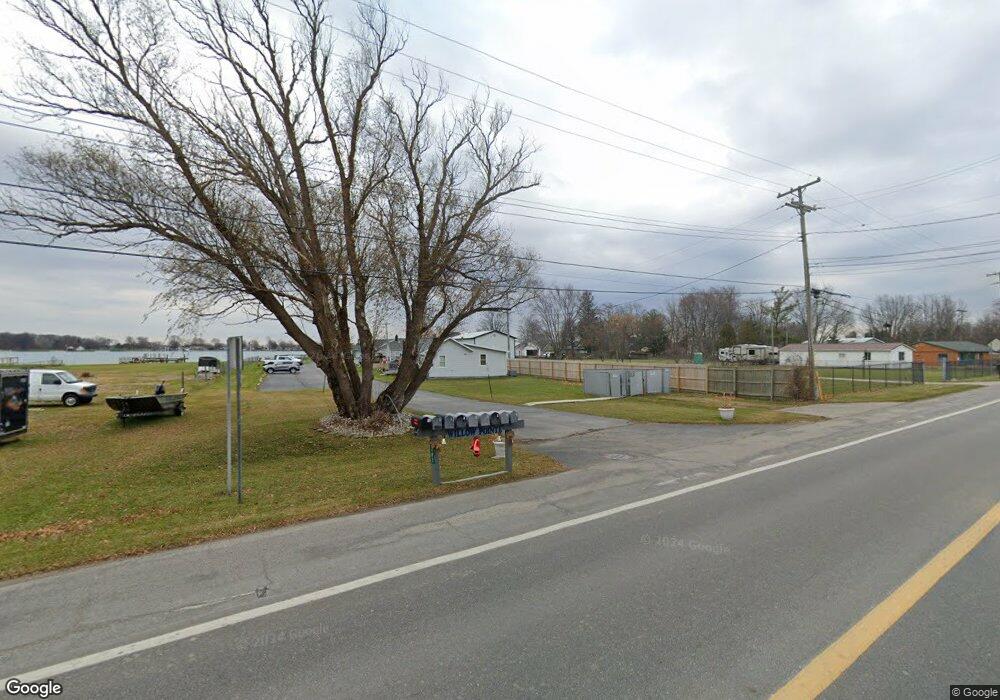
This home is located at 9287 River Rd Unit 8, Clay, MI 48001 and is currently estimated at $140,136, approximately $218 per square foot. 9287 River Rd Unit 8 is a home located in St. Clair County.
Ownership History
Date
Name
Owned For
Owner Type
Purchase Details
Closed on
Jul 9, 2020
Sold by
Bedard Jodee
Bought by
Maison Rental Management Llc
Current Estimated Value
Purchase Details
Closed on
Feb 9, 2018
Sold by
Bedard Jodee M
Bought by
Bedard Jodee M
Purchase Details
Closed on
Sep 8, 2017
Sold by
Bedard Jodee and Leblanc Dolores
Bought by
Bedard Jodee
Purchase Details
Closed on
Nov 13, 2013
Sold by
Bedard Jodee
Bought by
Bedard Jodee and Leblanc Dolores
Purchase Details
Closed on
Oct 18, 2006
Sold by
Hostetter Chris M and Hostetter Christian M
Bought by
Hostetter Christian M and Switanowski Corey R
Purchase Details
Closed on
Sep 13, 2005
Sold by
Kunnath Peterfeso Curtis
Bought by
Hostetter Chris M
Home Financials for this Owner
Home Financials are based on the most recent Mortgage that was taken out on this home.
Original Mortgage
$35,200
Interest Rate
5.93%
Mortgage Type
New Conventional
Create a Home Valuation Report for This Property
The Home Valuation Report is an in-depth analysis detailing your home's value as well as a comparison with similar homes in the area
Home Values in the Area
Average Home Value in this Area
Purchase History
| Date | Buyer | Sale Price | Title Company |
|---|---|---|---|
| Maison Rental Management Llc | -- | Bedard Jodee | |
| Bedard Jodee M | -- | -- | |
| Bedard Jodee | -- | -- | |
| Bedard Jodee | -- | Lighthouse Title Inc | |
| Bedard Jodee | $54,000 | Lighthouse Title Inc | |
| Hostetter Christian M | -- | None Available | |
| Hostetter Chris M | $44,000 | None Available | |
| Peterfeso Curtis J | $41,400 | None Available |
Source: Public Records
Mortgage History
| Date | Status | Borrower | Loan Amount |
|---|---|---|---|
| Previous Owner | Peterfeso Curtis J | $35,200 |
Source: Public Records
Tax History
| Year | Tax Paid | Tax Assessment Tax Assessment Total Assessment is a certain percentage of the fair market value that is determined by local assessors to be the total taxable value of land and additions on the property. | Land | Improvement |
|---|---|---|---|---|
| 2025 | $1,203 | $57,200 | $0 | $0 |
| 2024 | $1,173 | $45,100 | $0 | $0 |
| 2023 | $1,124 | $39,900 | $0 | $0 |
| 2022 | $1,404 | $36,200 | $0 | $0 |
| 2020 | $1,340 | $35,100 | $35,100 | $0 |
| 2019 | $1,305 | $32,900 | $0 | $0 |
| 2018 | $1,285 | $29,200 | $0 | $0 |
| 2017 | $754 | $27,500 | $0 | $0 |
| 2016 | $469 | $27,500 | $0 | $0 |
| 2015 | -- | $26,900 | $26,900 | $0 |
| 2014 | -- | $24,200 | $24,200 | $0 |
| 2013 | -- | $18,600 | $0 | $0 |
Source: Public Records
Map
Nearby Homes
- 9280 River Rd
- 9591 River Rd
- 389 S Parkway Dr
- 9898 N River Rd
- 9236 N River Rd
- 9287 N River Rd Unit 1
- 9287 N River Rd Unit 1 2 & 3
- 9287 N River Rd Unit 3
- 9287 N River Rd Unit 2
- 2567 St Clair River Dr
- 8518 S River Rd
- 2037 W Park Dr
- 474 South St
- 600 Cherry St
- 00 Roselawn St
- 0000 Lee St
- 142 Channel Syde Dr
- 1806 Michigan St
- 8866 Marsh Rd
- 114 Interlochen Dr
- 9287 River Rd
- 9287 River Rd Unit 9 UNIT
- 9287 River Rd
- 9287 River Rd Unit 10
- 9287 River Rd Unit 9
- 9287 River Rd Unit 8
- 9287 River Rd
- 9287 River Rd Unit 5
- 9287 River Rd Unit 4
- 9287 River Rd Unit 3
- 9287 River Rd Unit 2
- 9287 River Rd Unit 1
- 9287 River Rd Unit 1 2 & 3
- 9287 River Rd Unit 4
- 9287 River Rd Unit 6
- 9287 N River #9 Unit
- 9287 River Rd Unit 10
- 9287 River Rd
- 9287 River Rd Unit 4
- 9287 River Rd Unit 7
Your Personal Tour Guide
Ask me questions while you tour the home.