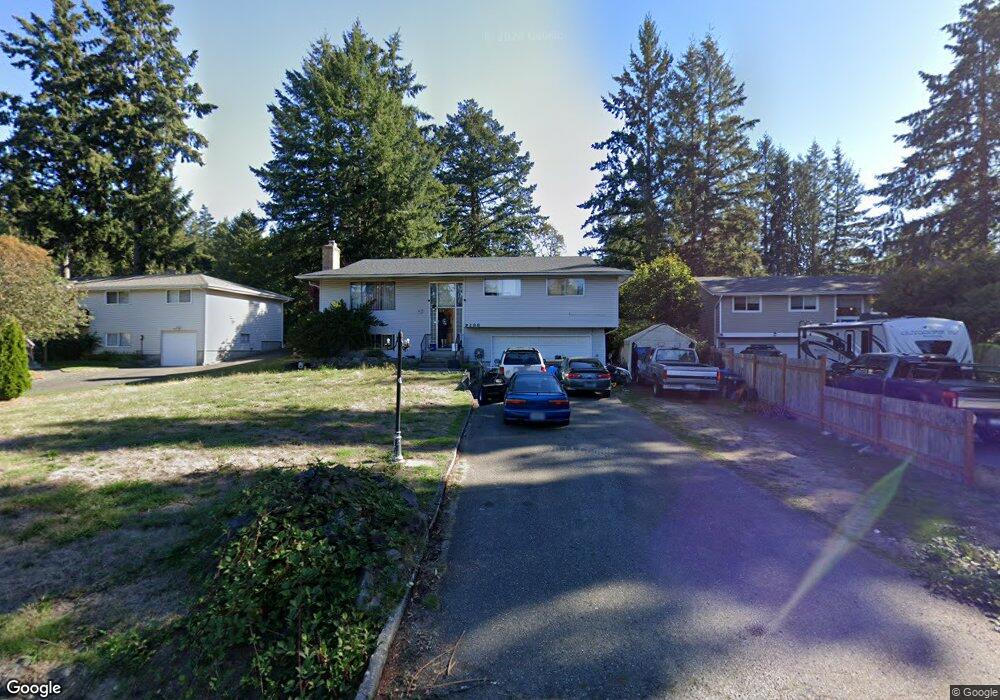
9288 Olson Rd NW Bremerton, WA 98311
Estimated Value: $518,407 - $555,000
3
Beds
3
Baths
1,930
Sq Ft
$280/Sq Ft
Est. Value
About This Home
This home is located at 9288 Olson Rd NW, Bremerton, WA 98311 and is currently estimated at $540,102, approximately $279 per square foot. 9288 Olson Rd NW is a home located in Kitsap County with nearby schools including Silver Ridge Elementary School, Central Kitsap Middle School, and Central Kitsap High School.
Ownership History
Date
Name
Owned For
Owner Type
Purchase Details
Closed on
Sep 22, 2010
Sold by
Thompson Justin E and Thompson Kim M
Bought by
Standley Vita Ann
Current Estimated Value
Home Financials for this Owner
Home Financials are based on the most recent Mortgage that was taken out on this home.
Original Mortgage
$242,731
Outstanding Balance
$159,712
Interest Rate
4.37%
Mortgage Type
FHA
Estimated Equity
$380,390
Purchase Details
Closed on
Feb 19, 2004
Sold by
Campisi Gary T and Campisi Catherine
Bought by
Thompson Justin E and Thompson Kim M
Home Financials for this Owner
Home Financials are based on the most recent Mortgage that was taken out on this home.
Original Mortgage
$194,128
Interest Rate
5.85%
Mortgage Type
VA
Purchase Details
Closed on
Apr 22, 1997
Sold by
Va
Bought by
Campisi Gary T and Campisi Catherine
Home Financials for this Owner
Home Financials are based on the most recent Mortgage that was taken out on this home.
Original Mortgage
$118,800
Interest Rate
7.86%
Mortgage Type
VA
Create a Home Valuation Report for This Property
The Home Valuation Report is an in-depth analysis detailing your home's value as well as a comparison with similar homes in the area
Home Values in the Area
Average Home Value in this Area
Purchase History
| Date | Buyer | Sale Price | Title Company |
|---|---|---|---|
| Standley Vita Ann | $246,280 | Pacific Nw Title | |
| Thompson Justin E | $189,950 | Transnation Title | |
| Campisi Gary T | -- | Transnation Title Insurance |
Source: Public Records
Mortgage History
| Date | Status | Borrower | Loan Amount |
|---|---|---|---|
| Open | Standley Vita Ann | $242,731 | |
| Previous Owner | Thompson Justin E | $194,128 | |
| Previous Owner | Campisi Gary T | $118,800 |
Source: Public Records
Tax History Compared to Growth
Tax History
| Year | Tax Paid | Tax Assessment Tax Assessment Total Assessment is a certain percentage of the fair market value that is determined by local assessors to be the total taxable value of land and additions on the property. | Land | Improvement |
|---|---|---|---|---|
| 2026 | $4,358 | $461,890 | $124,400 | $337,490 |
| 2025 | $4,358 | $461,890 | $124,400 | $337,490 |
| 2024 | $4,239 | $461,890 | $124,400 | $337,490 |
| 2023 | $4,163 | $451,590 | $138,200 | $313,390 |
| 2022 | $4,015 | $384,070 | $117,380 | $266,690 |
| 2021 | $3,875 | $352,980 | $107,390 | $245,590 |
| 2020 | $3,544 | $326,580 | $99,070 | $227,510 |
| 2019 | $3,390 | $302,520 | $91,580 | $210,940 |
| 2018 | $3,644 | $252,800 | $72,350 | $180,450 |
| 2017 | $3,241 | $252,800 | $72,350 | $180,450 |
| 2016 | $3,176 | $229,120 | $72,350 | $156,770 |
| 2015 | $3,042 | $229,120 | $72,350 | $156,770 |
| 2014 | -- | $216,410 | $72,350 | $144,060 |
| 2013 | -- | $216,410 | $72,350 | $144,060 |
Source: Public Records
Map
Nearby Homes
- 9310 Olson Rd NW
- 9302 Monte Vista Ln NW
- 9388 Kristine Dr NW
- 9428 Tracyton Blvd NW
- 9637 Fredrickson Rd NW
- 9695 Spinnaker Blvd NW
- 9632 Windswept Ln NW
- 9619 Windswept Ln NW
- 9757 Spinnaker Blvd NW
- 9155 Kristi Ct NW
- 1210 NW Huckle Dr
- 9656 Sandy Isle Ln NW
- 1135 NW Windy Beach Ln
- 1737 NW Chena Rd
- 910 NW Leisure Ln
- 922 Mahogany Ln NW
- 9102 Nels Nelson Rd NW
- 9346 Nels Nelson Rd NW
- 981 Mahogany Ln NW
- 10212 Ramble Dr NW
- 9262 Olson Rd NW
- 9338 Olson Rd NW
- 9232 Olson Rd NW
- 9309 Kimberly Place NW
- 9313 Kimberly Place NW
- 1690 NW Silver St
- 9261 Olson Rd NW
- 9287 Olson Rd NW
- 9339 Kimberly Place NW
- 9311 Olson Rd NW
- 9362 Olson Rd NW
- 1670 NW Silver St
- 1580 NW Silver St
- 9369 Kimberly Place NW
- 9337 Olson Rd NW
- 9305 Kimberly Place NW
- 1720 NW Silver St
- 9392 Olson Rd NW
- 1546 NW Silver St
- 9361 Olson Rd NW