Estimated Value: $374,000 - $437,000
3
Beds
2
Baths
2,263
Sq Ft
$174/Sq Ft
Est. Value
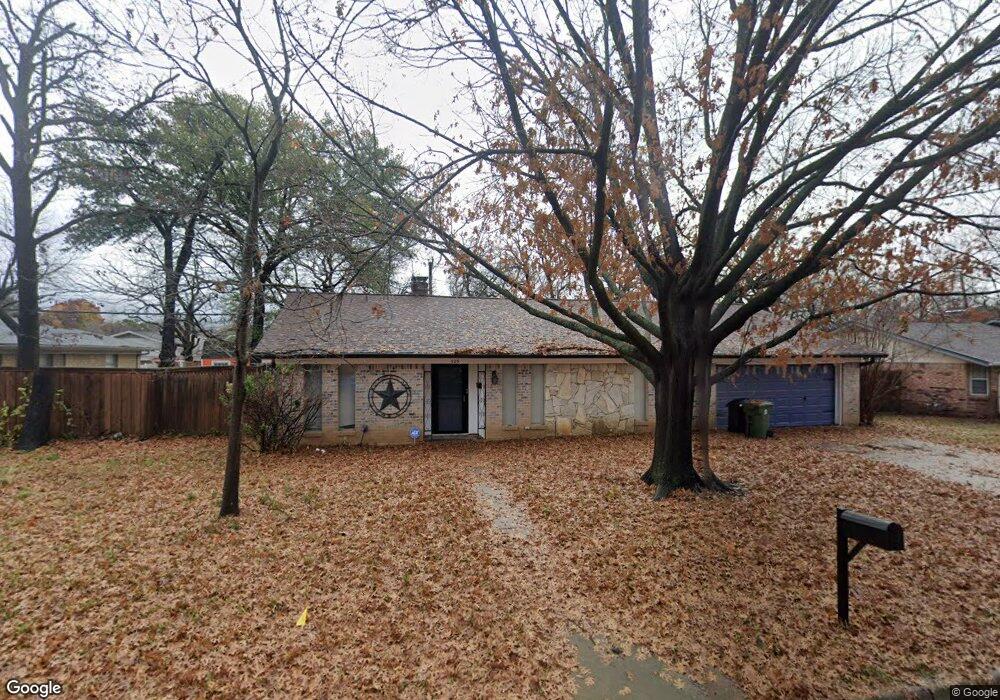
About This Home
This home is located at 929 Bedford Ct W, Hurst, TX 76053 and is currently estimated at $394,889, approximately $174 per square foot. 929 Bedford Ct W is a home located in Tarrant County with nearby schools including Donna Park Elementary, Bedford Junior High School, and L.D. Bell High School.
Ownership History
Date
Name
Owned For
Owner Type
Purchase Details
Closed on
Apr 17, 2020
Sold by
Moore Robert
Bought by
Nivholas Stephen
Current Estimated Value
Home Financials for this Owner
Home Financials are based on the most recent Mortgage that was taken out on this home.
Original Mortgage
$273,455
Outstanding Balance
$248,009
Interest Rate
4.75%
Mortgage Type
FHA
Estimated Equity
$146,880
Purchase Details
Closed on
Mar 9, 2018
Sold by
Henson Dolores L and Henson Sylvia Ann
Bought by
Moore Robert and Moore Melissa
Home Financials for this Owner
Home Financials are based on the most recent Mortgage that was taken out on this home.
Original Mortgage
$180,000
Interest Rate
4.15%
Mortgage Type
New Conventional
Purchase Details
Closed on
Jun 27, 1998
Sold by
Spencer Vera K
Bought by
Henson James T and Henson Dolores L
Purchase Details
Closed on
Sep 12, 1994
Sold by
Murray George A
Bought by
Spencer Vera K
Create a Home Valuation Report for This Property
The Home Valuation Report is an in-depth analysis detailing your home's value as well as a comparison with similar homes in the area
Home Values in the Area
Average Home Value in this Area
Purchase History
| Date | Buyer | Sale Price | Title Company |
|---|---|---|---|
| Nivholas Stephen | -- | Texas Secure Title Company | |
| Moore Robert | -- | None Available | |
| Henson James T | -- | Old Republic Title | |
| Spencer Vera K | -- | -- |
Source: Public Records
Mortgage History
| Date | Status | Borrower | Loan Amount |
|---|---|---|---|
| Open | Nivholas Stephen | $273,455 | |
| Previous Owner | Moore Robert | $180,000 |
Source: Public Records
Tax History Compared to Growth
Tax History
| Year | Tax Paid | Tax Assessment Tax Assessment Total Assessment is a certain percentage of the fair market value that is determined by local assessors to be the total taxable value of land and additions on the property. | Land | Improvement |
|---|---|---|---|---|
| 2025 | $5,668 | $400,151 | $55,440 | $344,711 |
| 2024 | $5,668 | $400,151 | $55,440 | $344,711 |
| 2023 | $6,586 | $366,185 | $46,200 | $319,985 |
| 2022 | $6,881 | $298,850 | $46,200 | $252,650 |
| 2021 | $7,024 | $291,245 | $45,000 | $246,245 |
| 2020 | $5,101 | $212,000 | $45,000 | $167,000 |
| 2019 | $5,189 | $212,000 | $45,000 | $167,000 |
| 2018 | $1,231 | $174,494 | $22,000 | $152,494 |
| 2017 | $4,014 | $174,120 | $22,000 | $152,120 |
| 2016 | $3,649 | $162,281 | $22,000 | $140,281 |
| 2015 | $1,260 | $131,100 | $17,000 | $114,100 |
| 2014 | $1,260 | $131,100 | $17,000 | $114,100 |
Source: Public Records
Map
Nearby Homes
- 1108 Billie Ruth Ln
- 1016 Billie Ruth Ln
- 1001 Livingston Dr
- 1000 Madrid St
- 1220 Woodland Park Dr
- 1218 Wooded Trail
- 916 Zelda Dr
- 913 Zelda Dr
- 853 Royal Terrace
- 1230 Woodland Park Dr
- 1230 Wooded Trail
- 820 Bedford Ct W
- 833 W Cheryl Ave
- 1204 Princess Ln
- 829 Joanna Dr
- 849 Wheelwood Dr
- 649 Timberline Dr
- 1145 Terrace Trail
- 632 Forest Ln
- 632 Melbourne Ct
- 925 Bedford Ct W
- 933 Bedford Ct W
- 1108 Zelda Dr
- 1109 Billie Ruth Ln
- 920 Bedford Ct W
- 1105 Billie Ruth Ln
- 1104 Zelda Dr
- 916 Bedford Ct W
- 924 Bedford Ct W
- 921 Bedford Ct W
- 1001 Bedford Ct W
- 1101 Billie Ruth Ln
- 1100 Zelda Dr
- 1121 Billie Ruth Ln
- 1120 Zelda Dr
- 1105 Zelda Dr
- 1000 Bedford Ct W
- 1116 Billie Ruth Ln
- 1104 Billie Ruth Ln
- 1033 Billie Ruth Ln