Estimated Value: $130,000 - $160,000
3
Beds
2
Baths
1,312
Sq Ft
$114/Sq Ft
Est. Value
About This Home
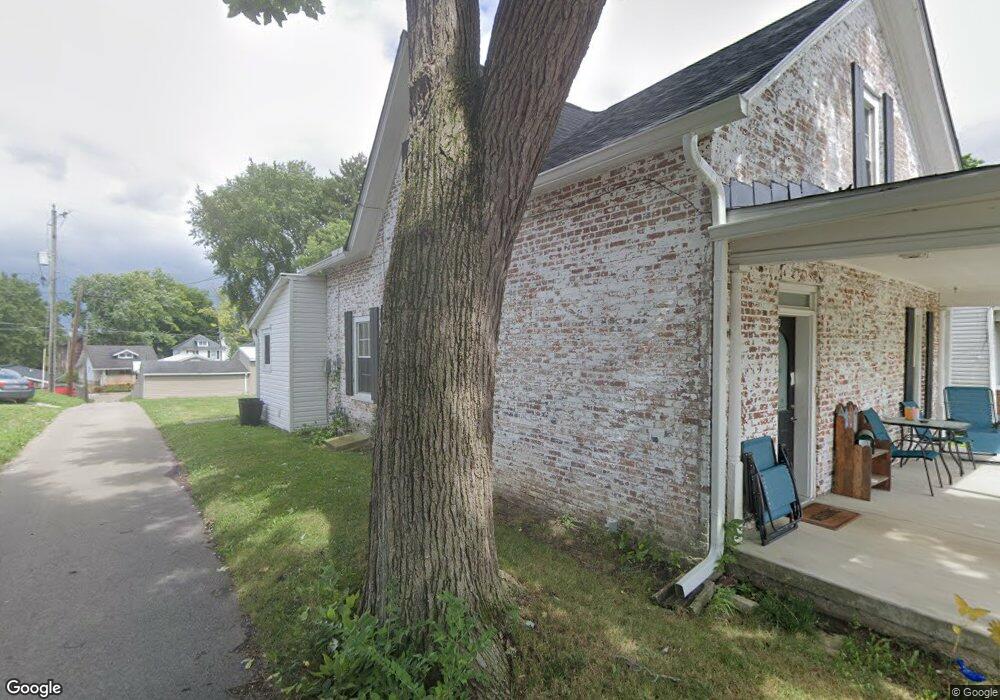
This home is located at 929 Broadway, Piqua, OH 45356 and is currently estimated at $148,922, approximately $113 per square foot. 929 Broadway is a home located in Miami County with nearby schools including Piqua Central Intermediate School, Springcreek Primary School, and Piqua Junior High School.
Ownership History
Date
Name
Owned For
Owner Type
Purchase Details
Closed on
May 12, 2016
Sold by
Fifth Third Mortgage Company
Bought by
Petitjean Steven M
Current Estimated Value
Purchase Details
Closed on
Nov 12, 2015
Sold by
Farrier Joshua G
Bought by
Fifth Third Mortgage Company
Purchase Details
Closed on
Oct 2, 2015
Sold by
Farrier Joshua G
Bought by
Fifth Third Mortgage Company
Purchase Details
Closed on
Oct 25, 2001
Sold by
Davis Judith
Bought by
Farrier Joshua G
Purchase Details
Closed on
Aug 1, 1979
Bought by
Davis Judith
Create a Home Valuation Report for This Property
The Home Valuation Report is an in-depth analysis detailing your home's value as well as a comparison with similar homes in the area
Home Values in the Area
Average Home Value in this Area
Purchase History
| Date | Buyer | Sale Price | Title Company |
|---|---|---|---|
| Petitjean Steven M | $22,500 | Servicelink Llc | |
| Fifth Third Mortgage Company | $34,000 | None Available | |
| Fifth Third Mortgage Company | $34,000 | Attorney | |
| Farrier Joshua G | $76,900 | -- | |
| Davis Judith | $28,300 | -- |
Source: Public Records
Mortgage History
| Date | Status | Borrower | Loan Amount |
|---|---|---|---|
| Closed | Farrier Joshua G | $0 |
Source: Public Records
Tax History
| Year | Tax Paid | Tax Assessment Tax Assessment Total Assessment is a certain percentage of the fair market value that is determined by local assessors to be the total taxable value of land and additions on the property. | Land | Improvement |
|---|---|---|---|---|
| 2024 | $1,575 | $31,680 | $9,240 | $22,440 |
| 2023 | $1,336 | $31,680 | $9,240 | $22,440 |
| 2022 | $1,359 | $31,680 | $9,240 | $22,440 |
| 2021 | $1,139 | $24,370 | $7,110 | $17,260 |
| 2020 | $1,120 | $24,370 | $7,110 | $17,260 |
| 2019 | $1,126 | $24,370 | $7,110 | $17,260 |
| 2018 | $1,019 | $21,010 | $7,390 | $13,620 |
| 2017 | $1,031 | $21,010 | $7,390 | $13,620 |
| 2016 | $1,021 | $21,010 | $7,390 | $13,620 |
| 2015 | $977 | $20,200 | $7,110 | $13,090 |
| 2014 | $977 | $20,200 | $7,110 | $13,090 |
| 2013 | $980 | $20,200 | $7,110 | $13,090 |
Source: Public Records
Map
Nearby Homes
- 508 Park Ave
- 606 Boone St
- 630 Boone St
- 505 Scott St
- 522 W North St
- 651 Boone St
- 735 Park Ave
- 502 Caldwell St
- 615 N Wayne St
- 333 W Greene St
- 1307 Walker St
- 423 N Wayne St
- 825 W Greene St
- 1507 Nicklin Ave
- 1115 Madison Ave
- 1514 Nicklin Ave
- 211 Franklin St
- 806 W High St
- 523 Harrison St
- 10175 Piqua Lockington Rd
Your Personal Tour Guide
Ask me questions while you tour the home.