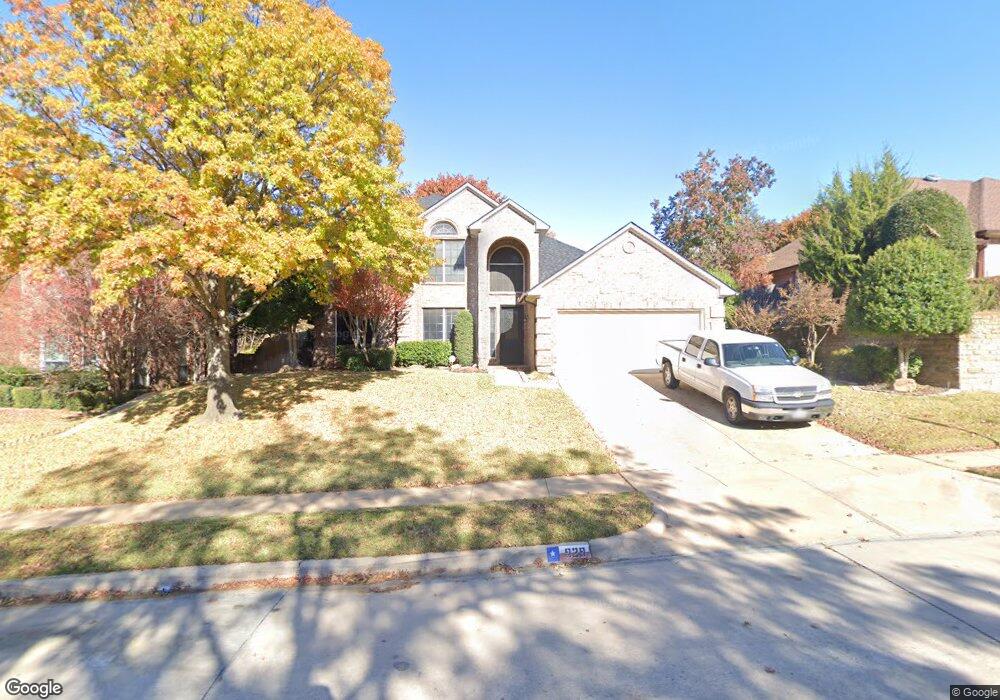
929 Carousel Dr Bedford, TX 76021
Estimated Value: $546,218 - $679,000
4
Beds
3
Baths
2,748
Sq Ft
$212/Sq Ft
Est. Value
About This Home
This home is located at 929 Carousel Dr, Bedford, TX 76021 and is currently estimated at $583,805, approximately $212 per square foot. 929 Carousel Dr is a home located in Tarrant County with nearby schools including Bedford Heights Elementary School, Bedford Junior High School, and L.D. Bell High School.
Ownership History
Date
Name
Owned For
Owner Type
Purchase Details
Closed on
Jul 15, 2015
Sold by
Davis James F and Davis Paula G
Bought by
Sullivan Chad and Sullivan Angela
Current Estimated Value
Home Financials for this Owner
Home Financials are based on the most recent Mortgage that was taken out on this home.
Original Mortgage
$230,320
Outstanding Balance
$177,823
Interest Rate
3.9%
Mortgage Type
New Conventional
Estimated Equity
$405,982
Purchase Details
Closed on
Jun 30, 1998
Sold by
D R Horton Texas Ltd
Bought by
Davis James F and Davis Paula G
Home Financials for this Owner
Home Financials are based on the most recent Mortgage that was taken out on this home.
Original Mortgage
$186,150
Interest Rate
7.08%
Create a Home Valuation Report for This Property
The Home Valuation Report is an in-depth analysis detailing your home's value as well as a comparison with similar homes in the area
Home Values in the Area
Average Home Value in this Area
Purchase History
| Date | Buyer | Sale Price | Title Company |
|---|---|---|---|
| Sullivan Chad | -- | Capital Title | |
| Davis James F | -- | D R H Title |
Source: Public Records
Mortgage History
| Date | Status | Borrower | Loan Amount |
|---|---|---|---|
| Open | Sullivan Chad | $230,320 | |
| Previous Owner | Davis James F | $186,150 |
Source: Public Records
Tax History
| Year | Tax Paid | Tax Assessment Tax Assessment Total Assessment is a certain percentage of the fair market value that is determined by local assessors to be the total taxable value of land and additions on the property. | Land | Improvement |
|---|---|---|---|---|
| 2025 | $8,306 | $523,276 | $100,000 | $423,276 |
| 2024 | $8,306 | $523,276 | $100,000 | $423,276 |
| 2023 | $7,536 | $535,596 | $75,000 | $460,596 |
| 2022 | $10,018 | $458,688 | $75,000 | $383,688 |
| 2021 | $8,815 | $374,224 | $75,000 | $299,224 |
| 2020 | $8,573 | $360,575 | $75,000 | $285,575 |
| 2019 | $8,811 | $362,674 | $75,000 | $287,674 |
| 2018 | $8,159 | $335,864 | $75,000 | $260,864 |
| 2017 | $7,992 | $330,347 | $50,000 | $280,347 |
| 2016 | $6,790 | $280,664 | $50,000 | $230,664 |
| 2015 | $6,294 | $261,600 | $25,000 | $236,600 |
| 2014 | $6,294 | $261,600 | $25,000 | $236,600 |
Source: Public Records
Map
Nearby Homes
- 1116 Carousel Dr
- 1116 Clear View Dr
- 840 Ridge Dr
- 1109 Simpson Terrace
- 3605 Spring Valley Dr
- 3008 Everest Dr
- 3016 Matterhorn Dr
- 1209 Hillandale Ct
- 3108 Spring Valley Dr
- 930 Shady Creek Ln
- 704 Morning Glory Ln
- 1105 Springdale Rd
- 1252 Royal Crescent Dr
- 2704 Shady Grove Dr
- 410 Carolyn Dr
- 413 Blue Jay Ct
- 405 Woodbriar Ct
- 3907 Copperwood Ct
- 2901 Miles Way
- 3006 Carolyn Ct
- 925 Carousel Dr
- 933 Carousel Dr
- 928 Crestview Dr
- 924 Crestview Dr
- 921 Carousel Dr
- 932 Crestview Dr
- 928 Carousel Dr
- 924 Carousel Dr
- 932 Carousel Dr
- 920 Crestview Dr
- 917 Carousel Dr
- 1001 Carousel Dr
- 920 Carousel Dr
- 916 Crestview Dr
- 1000 Crestview Dr
- 1000 Carousel Dr
- 916 Carousel Dr
- 913 Carousel Dr
- 933 Clear View Dr
- 929 Clear View Dr
Your Personal Tour Guide
Ask me questions while you tour the home.