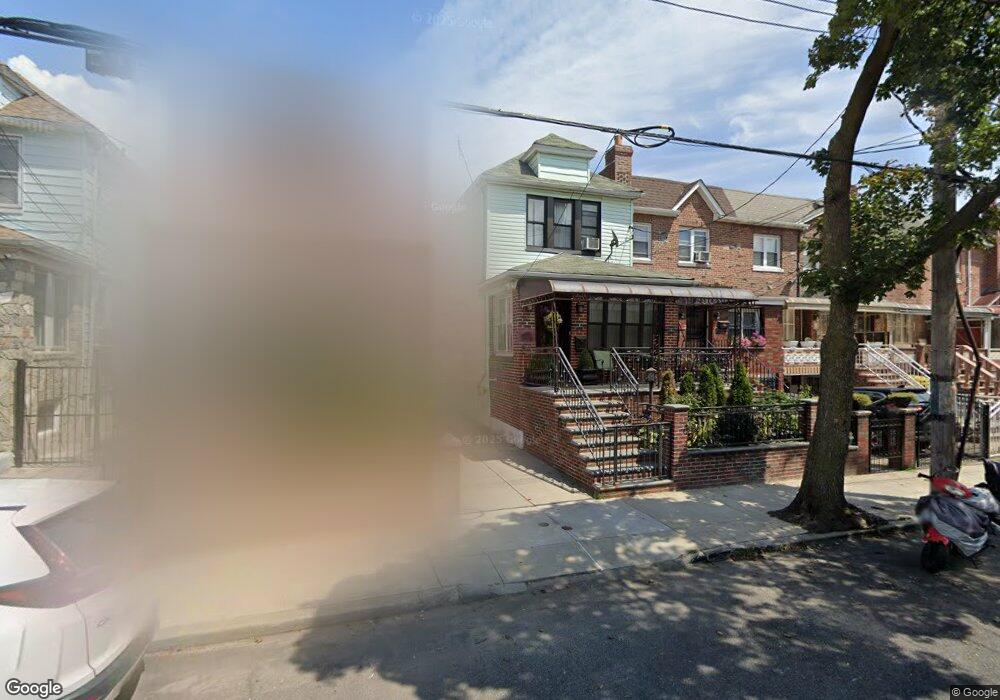
929 E 48th St Brooklyn, NY 11203
East Flatbush NeighborhoodEstimated Value: $670,996 - $862,000
Studio
--
Bath
1,335
Sq Ft
$563/Sq Ft
Est. Value
About This Home
This home is located at 929 E 48th St, Brooklyn, NY 11203 and is currently estimated at $751,999, approximately $563 per square foot. 929 E 48th St is a home located in Kings County with nearby schools including P.S. 208 Elsa Ebeling, I.S. 285 Meyer Levin, and Ivy Hill Preparatory Charter School.
Ownership History
Date
Name
Owned For
Owner Type
Purchase Details
Closed on
Aug 10, 2021
Sold by
Barry Peter G
Bought by
Barry Peter G and Felix Karan
Current Estimated Value
Purchase Details
Closed on
Jul 25, 2017
Sold by
Barry Peter G and Decaille Bertha
Bought by
Barry Peter G
Purchase Details
Closed on
Aug 27, 2015
Sold by
Cumberbatch Knox N and Smith Tekeish
Bought by
Barry Peter and Decaille Bertha
Home Financials for this Owner
Home Financials are based on the most recent Mortgage that was taken out on this home.
Original Mortgage
$401,912
Interest Rate
4.01%
Purchase Details
Closed on
Jun 19, 2014
Sold by
Big Apple Rehab Corp
Bought by
Cumberbatch Knox N and Smith Tekeish
Home Financials for this Owner
Home Financials are based on the most recent Mortgage that was taken out on this home.
Original Mortgage
$417,302
Interest Rate
4.16%
Mortgage Type
New Conventional
Purchase Details
Closed on
Mar 22, 2013
Sold by
Soto Valarie
Bought by
Big Apple Rehab Corp
Purchase Details
Closed on
Feb 27, 2008
Sold by
Sarpong Kofi
Bought by
Hall Dirk
Home Financials for this Owner
Home Financials are based on the most recent Mortgage that was taken out on this home.
Original Mortgage
$504,000
Interest Rate
5.72%
Mortgage Type
Purchase Money Mortgage
Purchase Details
Closed on
Sep 18, 2006
Sold by
Mcclean Arlene
Bought by
Sarpong Kofi
Home Financials for this Owner
Home Financials are based on the most recent Mortgage that was taken out on this home.
Original Mortgage
$424,000
Interest Rate
6.47%
Mortgage Type
Purchase Money Mortgage
Purchase Details
Closed on
May 13, 2002
Sold by
Mcclean Arlene
Bought by
Mcclean Arlene
Home Financials for this Owner
Home Financials are based on the most recent Mortgage that was taken out on this home.
Original Mortgage
$219,037
Interest Rate
6.18%
Purchase Details
Closed on
Jul 31, 1997
Sold by
Sargeant Rudolph and Sargeant Pearl
Bought by
Mclean Arlene
Home Financials for this Owner
Home Financials are based on the most recent Mortgage that was taken out on this home.
Original Mortgage
$139,500
Interest Rate
7.38%
Create a Home Valuation Report for This Property
The Home Valuation Report is an in-depth analysis detailing your home's value as well as a comparison with similar homes in the area
Home Values in the Area
Average Home Value in this Area
Purchase History
| Date | Buyer | Sale Price | Title Company |
|---|---|---|---|
| Barry Peter G | -- | -- | |
| Barry Peter G | -- | -- | |
| Barry Peter | $485,000 | -- | |
| Cumberbatch Knox N | $425,000 | -- | |
| Big Apple Rehab Corp | $165,000 | -- | |
| Hall Dirk | $450,000 | -- | |
| Soto Valarie | $630,000 | -- | |
| Sarpong Kofi | $530,000 | -- | |
| Mcclean Arlene | -- | -- | |
| Mclean Arlene | $155,000 | -- |
Source: Public Records
Mortgage History
| Date | Status | Borrower | Loan Amount |
|---|---|---|---|
| Previous Owner | Barry Peter | $401,912 | |
| Previous Owner | Cumberbatch Knox N | $417,302 | |
| Previous Owner | Soto Valarie | $504,000 | |
| Previous Owner | Sarpong Kofi | $424,000 | |
| Previous Owner | Mcclean Arlene | $219,037 | |
| Previous Owner | Mclean Arlene | $139,500 | |
| Closed | Soto Valarie | $94,500 |
Source: Public Records
Tax History
| Year | Tax Paid | Tax Assessment Tax Assessment Total Assessment is a certain percentage of the fair market value that is determined by local assessors to be the total taxable value of land and additions on the property. | Land | Improvement |
|---|---|---|---|---|
| 2025 | $6,477 | $46,380 | $14,760 | $31,620 |
| 2024 | $6,477 | $39,480 | $14,760 | $24,720 |
| 2023 | $6,226 | $48,060 | $14,760 | $33,300 |
| 2022 | $6,080 | $39,360 | $14,760 | $24,600 |
| 2021 | $6,354 | $39,900 | $14,760 | $25,140 |
| 2020 | $2,980 | $32,880 | $14,760 | $18,120 |
| 2019 | $5,621 | $32,880 | $14,760 | $18,120 |
| 2018 | $5,207 | $25,545 | $11,857 | $13,688 |
| 2017 | $5,174 | $25,380 | $12,339 | $13,041 |
| 2016 | $5,030 | $25,159 | $13,815 | $11,344 |
| 2015 | $2,888 | $23,736 | $15,921 | $7,815 |
| 2014 | $2,888 | $22,394 | $13,348 | $9,046 |
Source: Public Records
Map
Nearby Homes
Your Personal Tour Guide
Ask me questions while you tour the home.