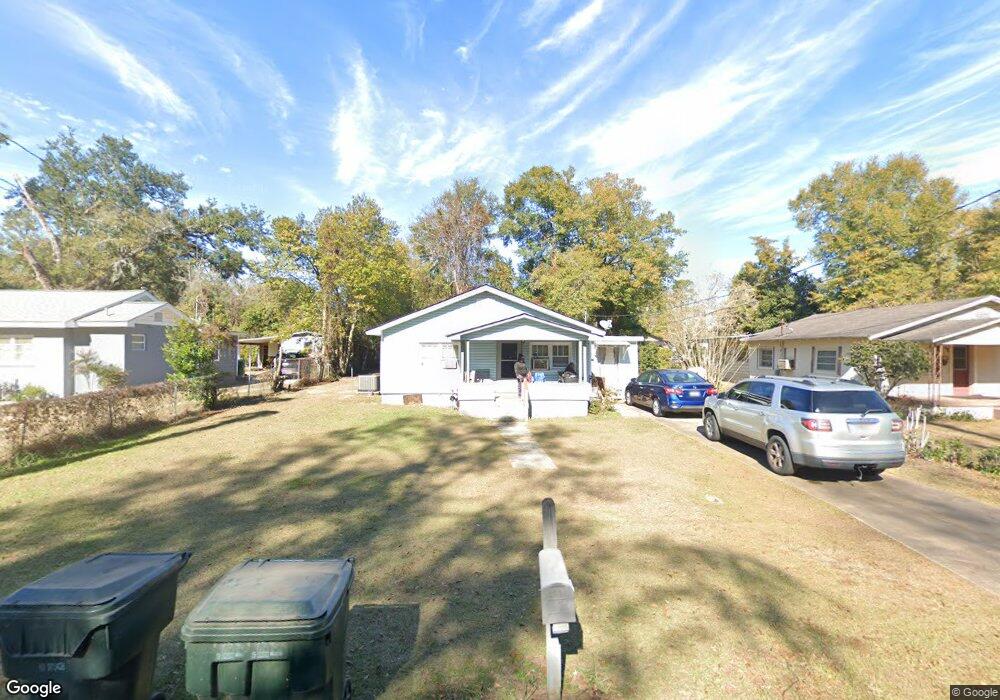
929 E Evans St Bainbridge, GA 39819
Estimated Value: $65,000 - $133,000
3
Beds
2
Baths
1,572
Sq Ft
$61/Sq Ft
Est. Value
About This Home
This home is located at 929 E Evans St, Bainbridge, GA 39819 and is currently estimated at $96,594, approximately $61 per square foot. 929 E Evans St is a home located in Decatur County with nearby schools including Bainbridge High School and Grace Christian Academy.
Ownership History
Date
Name
Owned For
Owner Type
Purchase Details
Closed on
Mar 1, 2021
Sold by
Cardinal Hill Holdings Llc
Bought by
Josey Shirley Jean and Dixon Sharon Josey
Current Estimated Value
Home Financials for this Owner
Home Financials are based on the most recent Mortgage that was taken out on this home.
Original Mortgage
$21,925
Outstanding Balance
$11,589
Interest Rate
2.7%
Mortgage Type
New Conventional
Estimated Equity
$85,005
Purchase Details
Closed on
Jul 29, 2019
Sold by
Southlife Holding Co Llc
Bought by
Cardinal Hill Holdings Llc
Purchase Details
Closed on
Feb 28, 2019
Sold by
Hall Properties Llc
Bought by
Southlife Holding Co Llc
Purchase Details
Closed on
Mar 21, 2006
Sold by
National Capital Propertie
Bought by
Hall Properties Llc
Purchase Details
Closed on
Nov 1, 2005
Sold by
Dockerson James A
Bought by
National Capital Properties In
Create a Home Valuation Report for This Property
The Home Valuation Report is an in-depth analysis detailing your home's value as well as a comparison with similar homes in the area
Purchase History
| Date | Buyer | Sale Price | Title Company |
|---|---|---|---|
| Josey Shirley Jean | $40,775 | -- | |
| Cardinal Hill Holdings Llc | -- | -- | |
| Southlife Holding Co Llc | $180,000 | -- | |
| Hall Properties Llc | $44,500 | -- | |
| National Capital Properties In | -- | -- |
Source: Public Records
Mortgage History
| Date | Status | Borrower | Loan Amount |
|---|---|---|---|
| Open | Josey Shirley Jean | $21,925 |
Source: Public Records
Tax History
| Year | Tax Paid | Tax Assessment Tax Assessment Total Assessment is a certain percentage of the fair market value that is determined by local assessors to be the total taxable value of land and additions on the property. | Land | Improvement |
|---|---|---|---|---|
| 2025 | $973 | $30,198 | $1,651 | $28,547 |
| 2024 | $792 | $25,051 | $1,651 | $23,400 |
| 2023 | $773 | $25,051 | $1,651 | $23,400 |
| 2022 | $503 | $25,051 | $1,651 | $23,400 |
| 2021 | $748 | $23,631 | $1,651 | $21,980 |
| 2020 | $583 | $22,419 | $1,651 | $20,768 |
| 2019 | $742 | $21,363 | $1,651 | $19,712 |
| 2018 | $734 | $21,363 | $1,651 | $19,712 |
| 2017 | $665 | $19,028 | $1,610 | $17,418 |
| 2016 | $665 | $19,028 | $1,610 | $17,418 |
| 2015 | $684 | $19,028 | $1,610 | $17,418 |
| 2014 | $634 | $19,028 | $1,610 | $17,418 |
| 2013 | -- | $19,027 | $1,610 | $17,417 |
Source: Public Records
Map
Nearby Homes
- 600 S Lamar St
- 502 Chason St
- 502 Chason St
- 809 S Lamar St
- 401 S Collier St
- 1020 E Water St
- 906 Elizabeth Place
- 306 S Boulevard Dr
- 640 E Shotwell St
- 1203 E Broughton St
- 632 E Evans St
- 1204 E Water St
- 703 S Boulevard Dr
- 539 Lake Douglas Drive Ext Dr
- 1307 E Broughton St
- 704 E College St
- Dell Rd
- 719 Hall St
- 1024 Tallahassee Rd
- 627 Planter St
- 931 E Evans St
- 927 E Evans St
- 944 E Sharpe St
- 925 E Evans St
- 946 E Sharpe St
- 935 E Evans St
- 912 E Sharpe St
- 910 E Sharpe St
- 500 S Lamar St
- 404 S Lamar St
- 918 E Evans St
- 1001 E Evans St
- 913 E Sharpe St
- 1003 E Evans St
- 911 E Sharpe St
- 502 S Lamar St
- 1000 E Evans St
- 917 E Evans St
- 318 S Lamar St
- 915 E Sharpe St
Your Personal Tour Guide
Ask me questions while you tour the home.