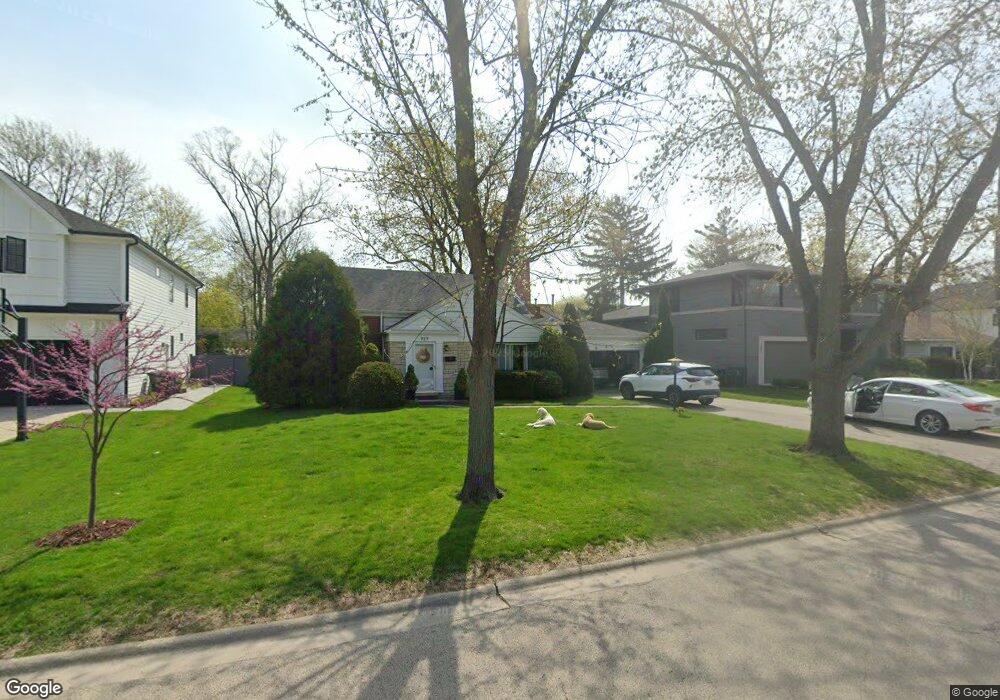
929 Echo Ln Glenview, IL 60025
Estimated Value: $594,000 - $937,000
3
Beds
2
Baths
1,239
Sq Ft
$574/Sq Ft
Est. Value
About This Home
This home is located at 929 Echo Ln, Glenview, IL 60025 and is currently estimated at $711,308, approximately $574 per square foot. 929 Echo Ln is a home located in Cook County with nearby schools including Romona Elementary School, Highcrest Middle School, and Wilmette Junior High School.
Ownership History
Date
Name
Owned For
Owner Type
Purchase Details
Closed on
Feb 14, 2001
Sold by
Pipia Richard N and Pipia Maria L
Bought by
Campbell James W and Bethke Jennifer C
Current Estimated Value
Home Financials for this Owner
Home Financials are based on the most recent Mortgage that was taken out on this home.
Original Mortgage
$275,000
Outstanding Balance
$94,303
Interest Rate
6.91%
Estimated Equity
$617,005
Purchase Details
Closed on
Jun 8, 1998
Sold by
Weustink J H Gerritsen and S Gerritsen Weustink J
Bought by
Pipia Richard N and Pipia Maria L
Home Financials for this Owner
Home Financials are based on the most recent Mortgage that was taken out on this home.
Original Mortgage
$150,000
Interest Rate
7%
Create a Home Valuation Report for This Property
The Home Valuation Report is an in-depth analysis detailing your home's value as well as a comparison with similar homes in the area
Home Values in the Area
Average Home Value in this Area
Purchase History
| Date | Buyer | Sale Price | Title Company |
|---|---|---|---|
| Campbell James W | $380,000 | -- | |
| Pipia Richard N | $305,000 | Professional National Title |
Source: Public Records
Mortgage History
| Date | Status | Borrower | Loan Amount |
|---|---|---|---|
| Open | Campbell James W | $275,000 | |
| Previous Owner | Pipia Richard N | $150,000 | |
| Closed | Campbell James W | $22,000 |
Source: Public Records
Tax History
| Year | Tax Paid | Tax Assessment Tax Assessment Total Assessment is a certain percentage of the fair market value that is determined by local assessors to be the total taxable value of land and additions on the property. | Land | Improvement |
|---|---|---|---|---|
| 2025 | $9,228 | $64,000 | $16,925 | $47,075 |
| 2024 | $9,228 | $41,731 | $16,925 | $24,806 |
| 2023 | $8,784 | $45,050 | $16,925 | $28,125 |
| 2022 | $8,784 | $45,050 | $16,925 | $28,125 |
| 2021 | $7,755 | $34,021 | $12,164 | $21,857 |
| 2020 | $7,625 | $34,021 | $12,164 | $21,857 |
| 2019 | $7,440 | $37,386 | $12,164 | $25,222 |
| 2018 | $7,591 | $36,209 | $10,049 | $26,160 |
| 2017 | $7,355 | $36,209 | $10,049 | $26,160 |
| 2016 | $7,099 | $36,209 | $10,049 | $26,160 |
| 2015 | $7,190 | $32,575 | $8,197 | $24,378 |
| 2014 | $7,058 | $32,575 | $8,197 | $24,378 |
| 2013 | $6,736 | $32,575 | $8,197 | $24,378 |
Source: Public Records
Map
Nearby Homes
- 337 Hager Ln
- 1031 Indian Rd
- 1041 Arbor Ln
- 808 Indian Rd
- 821 Harms Rd
- 716 Indian Rd
- 50 Glenview Rd
- 718 Lawler Ave
- 800 Glenview Rd
- 216 Briar Dr
- 846 Wagner Rd
- 3026 Highland Ave
- 10059 Frontage Rd Unit F
- 3534 Thornwood Ave
- 232 Kilpatrick Ave
- 2931 Greenleaf Ave
- 411 Woodland Ct
- 3031 Indianwood Rd
- 809 Lenox Rd
- 201 Valley View Dr
Your Personal Tour Guide
Ask me questions while you tour the home.