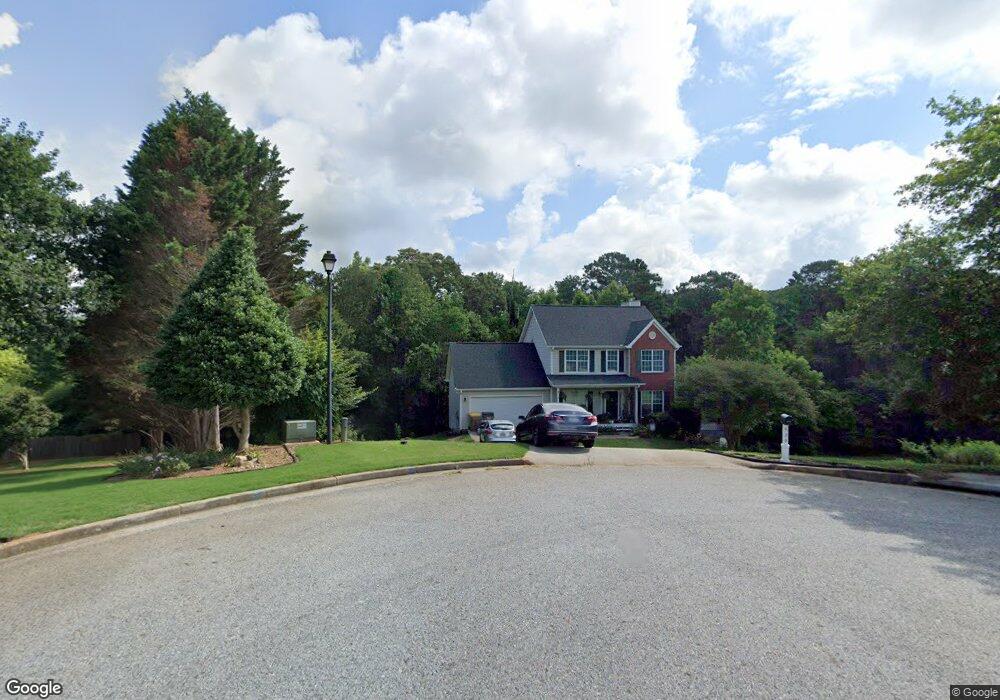
929 Elijah Way Bethlehem, GA 30620
Estimated Value: $339,724 - $362,000
3
Beds
3
Baths
1,740
Sq Ft
$202/Sq Ft
Est. Value
About This Home
This home is located at 929 Elijah Way, Bethlehem, GA 30620 and is currently estimated at $351,431, approximately $201 per square foot. 929 Elijah Way is a home located in Barrow County with nearby schools including Bethlehem Elementary School, Haymon-Morris Middle School, and Apalachee High School.
Ownership History
Date
Name
Owned For
Owner Type
Purchase Details
Closed on
Jun 28, 2010
Sold by
Townsend James W
Bought by
Spicer Richard and Spicer Adrienne
Current Estimated Value
Home Financials for this Owner
Home Financials are based on the most recent Mortgage that was taken out on this home.
Original Mortgage
$111,000
Interest Rate
4.83%
Mortgage Type
Trade
Purchase Details
Closed on
Jul 10, 2009
Sold by
Hud-Housing Of Urban Dev
Bought by
Townsend Jim
Purchase Details
Closed on
Nov 4, 2008
Sold by
Wells Fargo Bank Na
Bought by
Hud-Housing Of Urban Dev
Purchase Details
Closed on
Jan 16, 2002
Sold by
Elmo Fortenberry Builder
Bought by
Harden Leonila V
Home Financials for this Owner
Home Financials are based on the most recent Mortgage that was taken out on this home.
Original Mortgage
$133,482
Interest Rate
6.85%
Mortgage Type
FHA
Purchase Details
Closed on
Feb 7, 2001
Sold by
Casta Development In
Bought by
Buil Elmo Fortenbery
Purchase Details
Closed on
May 7, 1999
Bought by
Casta Development In
Create a Home Valuation Report for This Property
The Home Valuation Report is an in-depth analysis detailing your home's value as well as a comparison with similar homes in the area
Home Values in the Area
Average Home Value in this Area
Purchase History
| Date | Buyer | Sale Price | Title Company |
|---|---|---|---|
| Spicer Richard | $111,000 | -- | |
| Townsend Jim | -- | -- | |
| Hud-Housing Of Urban Dev | -- | -- | |
| Wells Fargo Bank Na | $138,333 | -- | |
| Harden Leonila V | $135,600 | -- | |
| Buil Elmo Fortenbery | $50,000 | -- | |
| Casta Development In | -- | -- |
Source: Public Records
Mortgage History
| Date | Status | Borrower | Loan Amount |
|---|---|---|---|
| Closed | Spicer Richard | $111,000 | |
| Previous Owner | Harden Leonila V | $133,482 |
Source: Public Records
Tax History Compared to Growth
Tax History
| Year | Tax Paid | Tax Assessment Tax Assessment Total Assessment is a certain percentage of the fair market value that is determined by local assessors to be the total taxable value of land and additions on the property. | Land | Improvement |
|---|---|---|---|---|
| 2024 | $2,614 | $106,638 | $25,000 | $81,638 |
| 2023 | $2,205 | $107,038 | $25,000 | $82,038 |
| 2022 | $2,780 | $98,686 | $20,000 | $78,686 |
| 2021 | $1,942 | $65,329 | $16,000 | $49,329 |
| 2020 | $1,943 | $65,329 | $16,000 | $49,329 |
| 2019 | $1,975 | $65,329 | $16,000 | $49,329 |
| 2018 | $1,829 | $61,329 | $12,000 | $49,329 |
| 2017 | $1,485 | $50,993 | $12,000 | $38,993 |
| 2016 | $1,435 | $49,485 | $12,000 | $37,485 |
| 2015 | $1,441 | $49,485 | $12,000 | $37,485 |
| 2014 | $1,282 | $43,786 | $5,880 | $37,906 |
| 2013 | -- | $41,400 | $5,880 | $35,520 |
Source: Public Records
Map
Nearby Homes
- 303 Carly Ct
- 0 McElhannon Rd SW Unit 10581793
- 1408 Wyndham Way
- 164 Manning Gin Rd
- 1050 Bethlehem Church Rd
- 784 Manger Ave
- 0 Manger Ave E Unit 20154677
- 0 Manger Ave E Unit 20127001
- 724 Manger Ave
- 1235 Dale Dr
- 449 & 455 Carl-Bethlehem Rd
- 1217 Cabin Bridge Rd
- 1109 Ravenwood Dr
- 1101 Ravenwood Dr
- 898 Harrison Mill Rd
- 3300 Jack Glass Rd
- 755 Harry McCarty Rd
- 0 Monroe Hwy Unit 10466108
- 0 Monroe Hwy Unit 7530054
- 797 Ode Peppers Rd
- 927 Elijah Way Unit 5
- 927 Elijah Way
- 930 Elijah Way
- 102 Timothy Ln
- 928 Elijah Way
- 104 Timothy Ln
- 926 Elijah Way
- 0 Timothy Ln Unit 7500961
- 0 Timothy Ln Unit 8488905
- 0 Timothy Ln
- 924 Elijah Way
- 106 Timothy Ln Unit 19A
- 106 Timothy Ln
- 921 Elijah Way
- 103 Timothy Ln
- 922 Elijah Way
- 105 Timothy Ln
- 107 Timothy Ln
- 920 Elijah Way
- 107 Timothy Lm