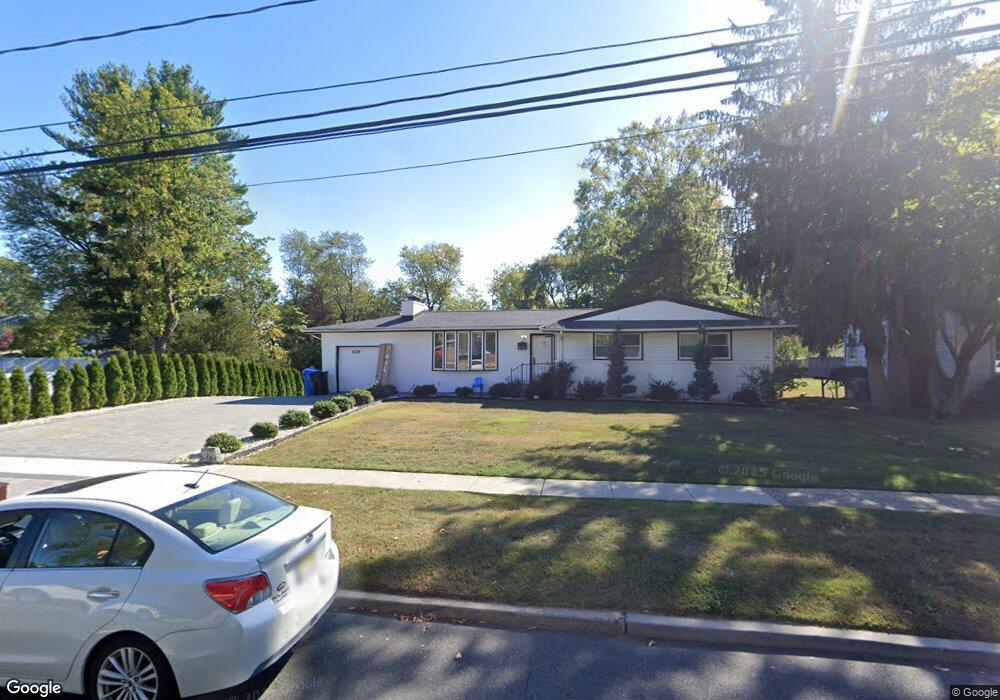
929 Franklin Ave South Plainfield, NJ 07080
Estimated Value: $627,000 - $712,000
4
Beds
3
Baths
--
Sq Ft
1.1
Acres
About This Home
This home is located at 929 Franklin Ave, South Plainfield, NJ 07080 and is currently estimated at $670,605. 929 Franklin Ave is a home located in Middlesex County with nearby schools including South Plainfield High School and The Queen City Academy Charter School.
Ownership History
Date
Name
Owned For
Owner Type
Purchase Details
Closed on
Jan 22, 2025
Sold by
Ramirez Jorge Armando Lopez and Perez Marta A
Bought by
Jorge Lopez Llc
Current Estimated Value
Home Financials for this Owner
Home Financials are based on the most recent Mortgage that was taken out on this home.
Original Mortgage
$487,000
Outstanding Balance
$483,715
Interest Rate
6.96%
Mortgage Type
New Conventional
Estimated Equity
$186,890
Purchase Details
Closed on
Nov 20, 2019
Sold by
Ejiochi Gabriel E and Ejiochi Mary Rose A
Bought by
Ramirez Jorge Armando Lopez and Hernandez Marta A Perez
Home Financials for this Owner
Home Financials are based on the most recent Mortgage that was taken out on this home.
Original Mortgage
$227,800
Interest Rate
3.75%
Mortgage Type
New Conventional
Purchase Details
Closed on
Jul 31, 1989
Bought by
Ejiochi Gabriel E and Mary Rose
Create a Home Valuation Report for This Property
The Home Valuation Report is an in-depth analysis detailing your home's value as well as a comparison with similar homes in the area
Home Values in the Area
Average Home Value in this Area
Purchase History
| Date | Buyer | Sale Price | Title Company |
|---|---|---|---|
| Jorge Lopez Llc | -- | Guardian Title Services | |
| Jorge Lopez Llc | -- | Guardian Title Services | |
| Ramirez Jorge Armando Lopez | $340,000 | Foundation Title Llc | |
| Ejiochi Gabriel E | $178,000 | -- |
Source: Public Records
Mortgage History
| Date | Status | Borrower | Loan Amount |
|---|---|---|---|
| Open | Jorge Lopez Llc | $487,000 | |
| Closed | Jorge Lopez Llc | $487,000 | |
| Previous Owner | Ramirez Jorge Armando Lopez | $227,800 |
Source: Public Records
Tax History Compared to Growth
Tax History
| Year | Tax Paid | Tax Assessment Tax Assessment Total Assessment is a certain percentage of the fair market value that is determined by local assessors to be the total taxable value of land and additions on the property. | Land | Improvement |
|---|---|---|---|---|
| 2025 | $9,895 | $141,720 | $46,700 | $95,020 |
| 2024 | $9,464 | $141,720 | $46,700 | $95,020 |
| 2023 | $9,464 | $141,720 | $46,700 | $95,020 |
| 2022 | $9,346 | $141,720 | $46,700 | $95,020 |
| 2021 | $8,623 | $133,900 | $46,700 | $87,200 |
| 2020 | $8,497 | $133,900 | $46,700 | $87,200 |
| 2019 | $8,153 | $133,900 | $46,700 | $87,200 |
| 2018 | $7,943 | $133,900 | $46,700 | $87,200 |
| 2017 | $7,841 | $133,900 | $46,700 | $87,200 |
| 2016 | $7,762 | $133,900 | $46,700 | $87,200 |
| 2015 | $7,628 | $133,900 | $46,700 | $87,200 |
| 2014 | $7,409 | $133,900 | $46,700 | $87,200 |
Source: Public Records
Map
Nearby Homes