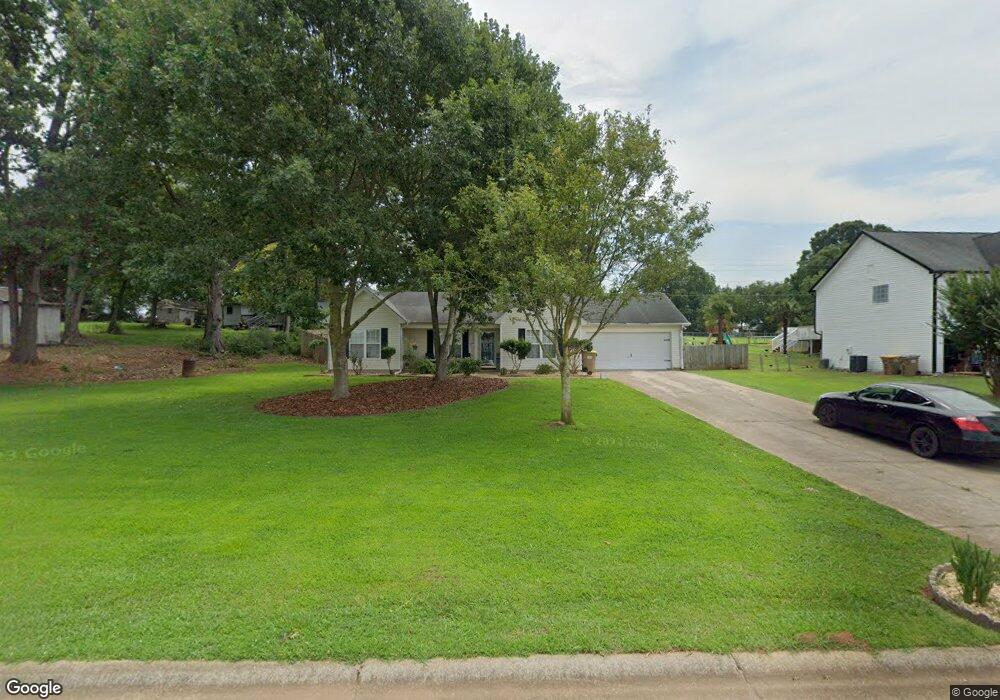
929 Justin Dr Unit 3 Winder, GA 30680
Estimated Value: $311,609 - $321,000
3
Beds
2
Baths
1,274
Sq Ft
$247/Sq Ft
Est. Value
About This Home
This home is located at 929 Justin Dr Unit 3, Winder, GA 30680 and is currently estimated at $314,402, approximately $246 per square foot. 929 Justin Dr Unit 3 is a home located in Barrow County with nearby schools including Holsenbeck Elementary School, Bear Creek Middle School, and Winder-Barrow High School.
Ownership History
Date
Name
Owned For
Owner Type
Purchase Details
Closed on
Oct 26, 2006
Sold by
Losch Laura K
Bought by
Cummings Ashley A and Cummings Kenneth C
Current Estimated Value
Home Financials for this Owner
Home Financials are based on the most recent Mortgage that was taken out on this home.
Original Mortgage
$121,840
Interest Rate
6.27%
Mortgage Type
FHA
Purchase Details
Closed on
May 30, 2001
Sold by
Custom Quality Builders
Bought by
Schutie Laura K
Home Financials for this Owner
Home Financials are based on the most recent Mortgage that was taken out on this home.
Original Mortgage
$97,315
Interest Rate
7.11%
Mortgage Type
New Conventional
Purchase Details
Closed on
Jan 17, 2001
Sold by
Patterson Ray and Patterson Bren
Bought by
Custom Quality Homes
Purchase Details
Closed on
May 22, 1980
Bought by
Patterson Ray and Patterson Bren
Create a Home Valuation Report for This Property
The Home Valuation Report is an in-depth analysis detailing your home's value as well as a comparison with similar homes in the area
Home Values in the Area
Average Home Value in this Area
Purchase History
| Date | Buyer | Sale Price | Title Company |
|---|---|---|---|
| Cummings Ashley A | $123,800 | -- | |
| Schutie Laura K | $100,400 | -- | |
| Custom Quality Homes | $18,000 | -- | |
| Patterson Ray | -- | -- |
Source: Public Records
Mortgage History
| Date | Status | Borrower | Loan Amount |
|---|---|---|---|
| Previous Owner | Cummings Ashley A | $121,840 | |
| Previous Owner | Schutie Laura K | $97,315 |
Source: Public Records
Tax History Compared to Growth
Tax History
| Year | Tax Paid | Tax Assessment Tax Assessment Total Assessment is a certain percentage of the fair market value that is determined by local assessors to be the total taxable value of land and additions on the property. | Land | Improvement |
|---|---|---|---|---|
| 2024 | $2,266 | $92,659 | $24,000 | $68,659 |
| 2023 | $1,438 | $75,616 | $18,000 | $57,616 |
| 2022 | $1,567 | $55,700 | $16,000 | $39,700 |
| 2021 | $1,645 | $55,700 | $16,000 | $39,700 |
| 2020 | $1,645 | $55,700 | $16,000 | $39,700 |
| 2019 | $1,672 | $55,700 | $16,000 | $39,700 |
| 2018 | $1,476 | $49,991 | $12,000 | $37,991 |
| 2017 | $1,134 | $38,952 | $12,000 | $26,952 |
| 2016 | $1,117 | $39,258 | $12,000 | $27,258 |
| 2015 | $1,122 | $39,258 | $12,000 | $27,258 |
| 2014 | $949 | $33,443 | $5,880 | $27,563 |
| 2013 | -- | $32,109 | $5,880 | $26,229 |
Source: Public Records
Map
Nearby Homes
- 1206 Corkybrooke Ln
- 917 Justin Dr Unit 3
- 388 Kay Dr Unit 1
- 1212 Highway 211 NE
- 1226 Highway 211 NE
- 1553 Shoal Creek Dr
- 1556 Shoal Creek Dr
- 508 Pleasant Hill Church Rd NE
- 867 Windward Rd
- 130 (Tract 1) Bowman Mill Rd NE
- 330 Anchors Way
- 130 Bowman Mill Rd NE Unit 1
- 0 Hancock Bridge Rd Unit 10535063
- 212 Rainbow Ln
- 63 Delightful Way Unit 1
- 385 Finch Landing Rd
- 162 Delightful Way Unit 28
- 203 Delightful Way Unit 5
- 1431 Solomon Dr
- 253 Delightful Way Unit 6
- 927 Justin Dr
- 1148 Highway 211 NE
- 930 Justin Dr Unit 3
- 926 Justin Dr
- 932 Justin Dr Unit 3
- 933 Justin Dr Unit 19
- 923 Justin Dr
- 922 Justin Dr
- 1162 Highway 211 NE
- 920 Justin Dr
- 934 Justin Dr
- 921 Justin Dr
- 921 Justin Dr Unit 3
- 921 Justin Dr Unit 71
- 935 Justin Dr Unit 3
- 1015 Brynn Dr
- 1018 Brynn Dr Unit 2
- 1018 Brynn Dr
- 918 Justin Dr
- 919 Justin Dr