Estimated Value: $138,576 - $157,000
2
Beds
2
Baths
1,064
Sq Ft
$139/Sq Ft
Est. Value
About This Home
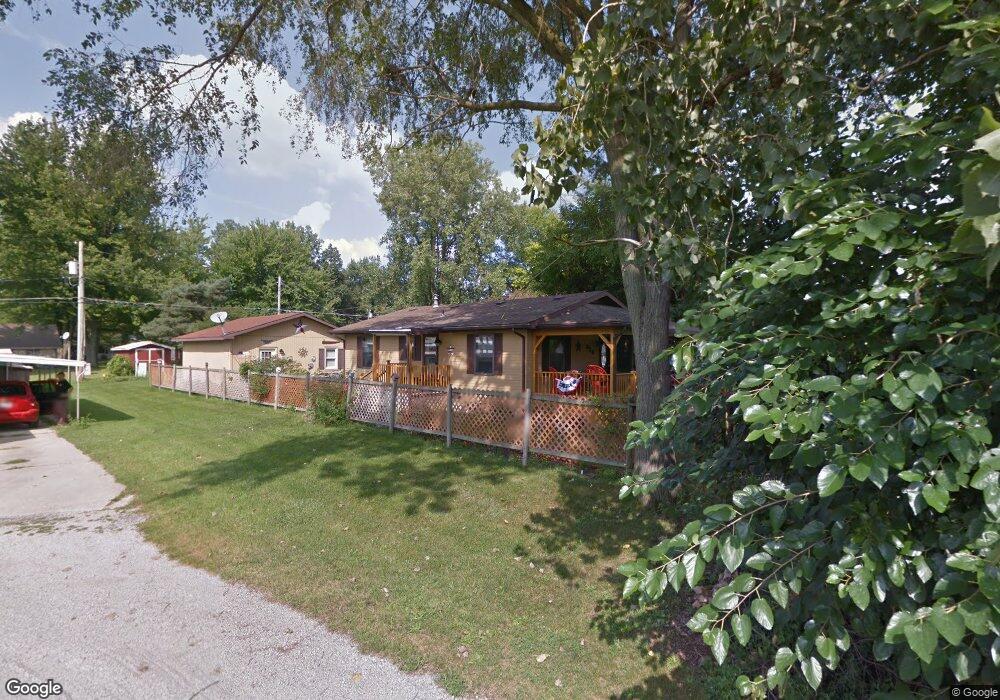
This home is located at 929 Linwood St, Delta, OH 43515 and is currently estimated at $148,144, approximately $139 per square foot. 929 Linwood St is a home located in Fulton County with nearby schools including Delta Elementary School, Pike-Delta-York Middle School, and Pike-Delta-York High School.
Ownership History
Date
Name
Owned For
Owner Type
Purchase Details
Closed on
Jun 23, 2023
Sold by
Rowland Darcy A
Bought by
Rowland Abigail M
Current Estimated Value
Home Financials for this Owner
Home Financials are based on the most recent Mortgage that was taken out on this home.
Original Mortgage
$84,390
Outstanding Balance
$82,117
Interest Rate
6.35%
Mortgage Type
New Conventional
Estimated Equity
$66,027
Purchase Details
Closed on
Jan 1, 1990
Bought by
Brien Judith A O
Create a Home Valuation Report for This Property
The Home Valuation Report is an in-depth analysis detailing your home's value as well as a comparison with similar homes in the area
Home Values in the Area
Average Home Value in this Area
Purchase History
| Date | Buyer | Sale Price | Title Company |
|---|---|---|---|
| Rowland Abigail M | $87,000 | None Listed On Document | |
| Rowland Abigail M | $87,000 | None Listed On Document | |
| Brien Judith A O | -- | -- |
Source: Public Records
Mortgage History
| Date | Status | Borrower | Loan Amount |
|---|---|---|---|
| Open | Rowland Abigail M | $84,390 | |
| Closed | Rowland Abigail M | $84,390 |
Source: Public Records
Tax History Compared to Growth
Tax History
| Year | Tax Paid | Tax Assessment Tax Assessment Total Assessment is a certain percentage of the fair market value that is determined by local assessors to be the total taxable value of land and additions on the property. | Land | Improvement |
|---|---|---|---|---|
| 2024 | $1,755 | $39,730 | $4,870 | $34,860 |
| 2023 | $1,755 | $39,730 | $4,870 | $34,860 |
| 2022 | $1,298 | $31,960 | $4,060 | $27,900 |
| 2021 | $1,318 | $31,960 | $4,060 | $27,900 |
| 2020 | $1,334 | $31,960 | $4,060 | $27,900 |
| 2019 | $1,104 | $28,460 | $4,060 | $24,400 |
| 2018 | $980 | $28,460 | $4,060 | $24,400 |
| 2017 | $972 | $28,460 | $4,060 | $24,400 |
| 2016 | $865 | $23,490 | $4,060 | $19,430 |
| 2015 | $829 | $23,490 | $4,060 | $19,430 |
| 2014 | $834 | $23,490 | $4,060 | $19,430 |
| 2013 | $825 | $23,600 | $3,470 | $20,130 |
Source: Public Records
Map
Nearby Homes
- 929 Linwood Ave
- 11 Meadow Lane Dr
- 703 Linwood Ave
- 600 Fernwood St
- 305 Mckinley St
- 413 Fernwood St
- 518 Providence St
- 421 Providence St
- 500 Sandalwood Ln
- 308 Monroe St
- 434 Monroe St
- 452 Monroe St
- 106 Adrian St
- 9163 County Road F
- 5390 County Road D
- 6854 County Road 3
- 3121 County Road Ef
- 7852 County Road C
- 106 Redbud Dr
- 3668 County Road 4
- 311 Jackson St
- 313 Jackson St
- 307 Jackson St
- 312 Jackson St
- 914 Fernwood St
- 310 Jackson St
- 314 Jackson St
- 316 Jackson St
- 912 Fernwood St
- 927 Linwood Ct
- 306 Jackson St
- 318 Jackson St
- 318 Jackson St
- 908 Fernwood St
- 304 Jackson St
- 917 Fernwood St
- 915 Fernwood St
- 912 Linwood Ct
- 913 Fernwood St
- 906 Linwood Ave