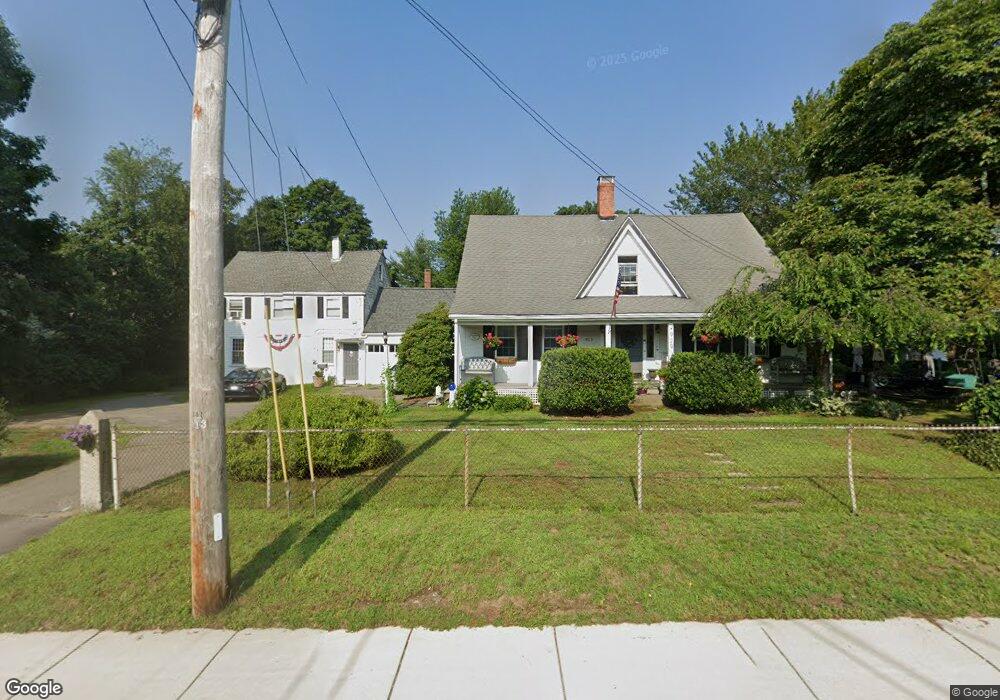
929 Main St South Weymouth, MA 02190
South Weymouth NeighborhoodEstimated Value: $820,000 - $901,000
3
Beds
3
Baths
4,228
Sq Ft
$204/Sq Ft
Est. Value
About This Home
This home is located at 929 Main St, South Weymouth, MA 02190 and is currently estimated at $860,500, approximately $203 per square foot. 929 Main St is a home located in Norfolk County with nearby schools including Thomas V Nash, Abigail Adams Middle School, and Weymouth Middle School Chapman.
Ownership History
Date
Name
Owned For
Owner Type
Purchase Details
Closed on
Jun 12, 1997
Sold by
Finnigan Jeanne M
Bought by
Dolphin Catherine L
Current Estimated Value
Home Financials for this Owner
Home Financials are based on the most recent Mortgage that was taken out on this home.
Original Mortgage
$197,000
Outstanding Balance
$25,649
Interest Rate
7.97%
Mortgage Type
Purchase Money Mortgage
Estimated Equity
$834,851
Create a Home Valuation Report for This Property
The Home Valuation Report is an in-depth analysis detailing your home's value as well as a comparison with similar homes in the area
Home Values in the Area
Average Home Value in this Area
Purchase History
| Date | Buyer | Sale Price | Title Company |
|---|---|---|---|
| Dolphin Catherine L | $15,000 | -- |
Source: Public Records
Mortgage History
| Date | Status | Borrower | Loan Amount |
|---|---|---|---|
| Open | Dolphin Catherine L | $197,000 |
Source: Public Records
Tax History Compared to Growth
Tax History
| Year | Tax Paid | Tax Assessment Tax Assessment Total Assessment is a certain percentage of the fair market value that is determined by local assessors to be the total taxable value of land and additions on the property. | Land | Improvement |
|---|---|---|---|---|
| 2025 | $7,953 | $787,400 | $204,700 | $582,700 |
| 2024 | $7,772 | $756,800 | $195,000 | $561,800 |
| 2023 | $7,561 | $723,500 | $180,500 | $543,000 |
| 2022 | $7,294 | $636,500 | $167,200 | $469,300 |
| 2021 | $7,352 | $626,200 | $167,200 | $459,000 |
| 2020 | $7,185 | $602,800 | $167,200 | $435,600 |
| 2019 | $7,004 | $577,900 | $160,700 | $417,200 |
| 2018 | $6,560 | $524,800 | $153,100 | $371,700 |
| 2017 | $6,209 | $484,700 | $145,800 | $338,900 |
| 2016 | $5,624 | $439,400 | $140,200 | $299,200 |
| 2015 | $5,329 | $413,100 | $140,200 | $272,900 |
| 2014 | $5,106 | $383,900 | $130,500 | $253,400 |
Source: Public Records
Map
Nearby Homes
- 18 Fountain Ln Unit 2
- 45 Union St
- 120 Randolph St
- 50 Hollis St
- 60 Greentree Ln Unit 38
- 27 Park Ave
- 55 Greentree Ln Unit 19
- 25 Wales Ave
- 193 Randolph St
- 261 Pleasant St Unit 5
- 7 Woodcrest Ct Unit 4
- 11 Woodcrest Ct Unit 5
- 10 Woodcrest Ct Unit 4
- 8 Woodcrest Ct Unit 4
- 102 White St
- 211 Randolph St
- 2 Mitchell Ln Unit B
- 24 Fisher Rd
- 16 Jay Rd
- 15 Ranger Cir
- 925 Main St
- 925 Main St Unit 1
- 937 Main St Unit 3
- 937 Main St Unit 1
- 14 Newbert Ave
- 16 Keating Cir
- 10 Keating Cir
- 10 Newbert Ave
- 928 Main St Unit C
- 928 Main St Unit A
- 22 Newbert Ave
- 947 Main St
- 932 Main St
- 949 Main St
- 936 Main St Unit 5
- 936 Main St Unit 2
- 936 Main St
- 936 Main St Unit 1
- 15 Newbert Ave
- 19 Roberts Dr