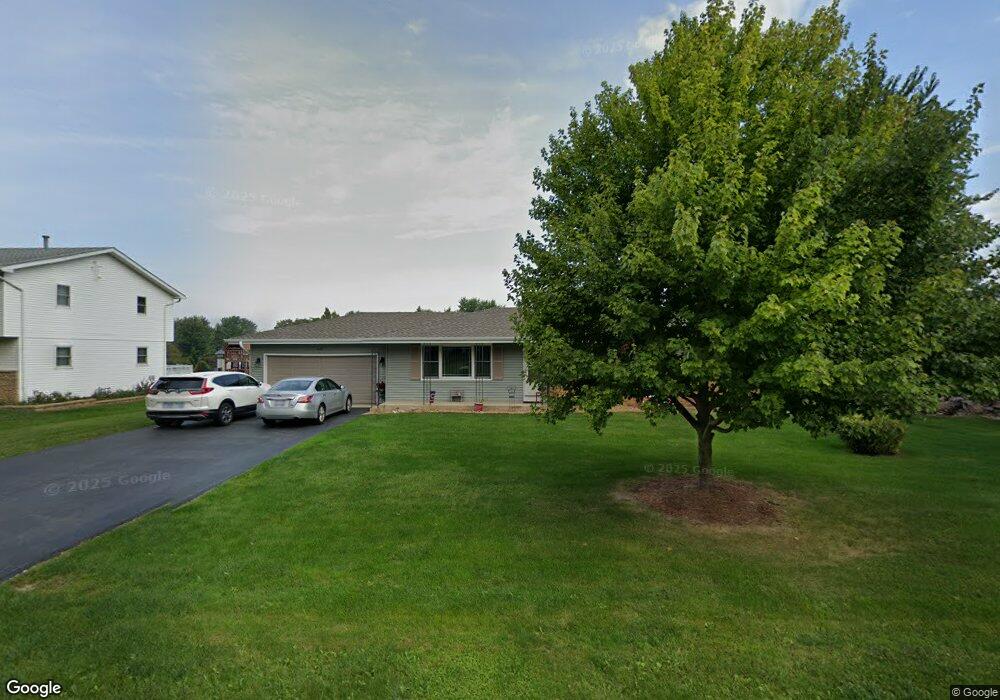
929 Melrose St New Lenox, IL 60451
Estimated Value: $318,860 - $426,000
3
Beds
3
Baths
--
Sq Ft
0.47
Acres
About This Home
This home is located at 929 Melrose St, New Lenox, IL 60451 and is currently estimated at $377,715. 929 Melrose St is a home located in Will County with nearby schools including Bentley Elementary School, Arnold J Tyler School, and Alex M Martino Jr High School.
Ownership History
Date
Name
Owned For
Owner Type
Purchase Details
Closed on
Feb 23, 2018
Sold by
Rtk Infinity Llc 929 Melrose
Bought by
Schober Joseph P and Schober Pearl P
Current Estimated Value
Home Financials for this Owner
Home Financials are based on the most recent Mortgage that was taken out on this home.
Original Mortgage
$230,743
Outstanding Balance
$197,861
Interest Rate
4.5%
Mortgage Type
FHA
Estimated Equity
$179,854
Purchase Details
Closed on
Jan 1, 2017
Sold by
Marquette Bank
Bought by
Rtk Infinity Llc
Purchase Details
Closed on
Jun 25, 2015
Sold by
Johnson Mike and Johnson Susan H
Bought by
Marquette Bank and Trust #19999
Purchase Details
Closed on
May 31, 2000
Sold by
Gierke Mabel and Gierke Edwin E
Bought by
Johnson Mike and Johnson Susan
Home Financials for this Owner
Home Financials are based on the most recent Mortgage that was taken out on this home.
Original Mortgage
$120,000
Interest Rate
8.18%
Create a Home Valuation Report for This Property
The Home Valuation Report is an in-depth analysis detailing your home's value as well as a comparison with similar homes in the area
Home Values in the Area
Average Home Value in this Area
Purchase History
| Date | Buyer | Sale Price | Title Company |
|---|---|---|---|
| Schober Joseph P | $235,000 | Chicago Title | |
| Rtk Infinity Llc | -- | None Available | |
| Marquette Bank | $206,000 | Citywide Title Corporation | |
| Johnson Mike | $142,500 | -- |
Source: Public Records
Mortgage History
| Date | Status | Borrower | Loan Amount |
|---|---|---|---|
| Open | Schober Joseph P | $230,743 | |
| Previous Owner | Johnson Mike | $120,000 |
Source: Public Records
Tax History Compared to Growth
Tax History
| Year | Tax Paid | Tax Assessment Tax Assessment Total Assessment is a certain percentage of the fair market value that is determined by local assessors to be the total taxable value of land and additions on the property. | Land | Improvement |
|---|---|---|---|---|
| 2024 | $7,042 | $97,995 | $33,966 | $64,029 |
| 2023 | $7,042 | $89,330 | $30,963 | $58,367 |
| 2022 | $6,364 | $82,294 | $28,524 | $53,770 |
| 2021 | $6,033 | $77,395 | $26,826 | $50,569 |
| 2020 | $5,855 | $74,634 | $25,869 | $48,765 |
| 2019 | $6,102 | $72,320 | $25,067 | $47,253 |
| 2018 | $5,973 | $69,827 | $24,203 | $45,624 |
| 2017 | $5,680 | $67,819 | $23,507 | $44,312 |
| 2016 | $5,523 | $66,004 | $22,878 | $43,126 |
| 2015 | $4,823 | $63,927 | $22,158 | $41,769 |
| 2014 | $4,823 | $63,137 | $21,884 | $41,253 |
| 2013 | $4,823 | $63,988 | $22,179 | $41,809 |
Source: Public Records
Map
Nearby Homes
- 214 Somerset Ct
- 709 Garadice Dr
- 1535 Glenbrooke Ln
- 1351 E Lincoln Hwy
- 701 Bishops Gate
- 513 Somerset Ln
- 641 Lisson Grove
- 125 N Anderson Rd
- 449 Somerset Ln Unit 1
- 1017 E Lincoln Hwy
- 1212 Georgias Way
- 1245 Georgias Way
- 1193 Georgias Way
- 920 Barnside Rd
- 1139 Georgias Way
- 203 Tonell Ave
- 1125 Georgias Way
- 651 Schooner Dr
- 621 Chatfield Rd
- 235 Roberts Rd
- 923 Melrose St
- 933 Melrose St
- 921 Melrose St
- 928 Regent St
- 934 Regent St
- 924 Regent St
- 935 Melrose St
- 241 Somerset Ct
- 928 Melrose St
- 924 Melrose St
- 920 Regent St
- 936 Regent St
- 932 Melrose St
- 917 Melrose St
- 920 Melrose St
- 936 Melrose St
- 940 Regent St
- 916 Regent St
- Lot 10 Somerset Ct
- Lot 9 Somerset Ct