Estimated Value: $246,000 - $273,000
3
Beds
3
Baths
1,857
Sq Ft
$138/Sq Ft
Est. Value
About This Home
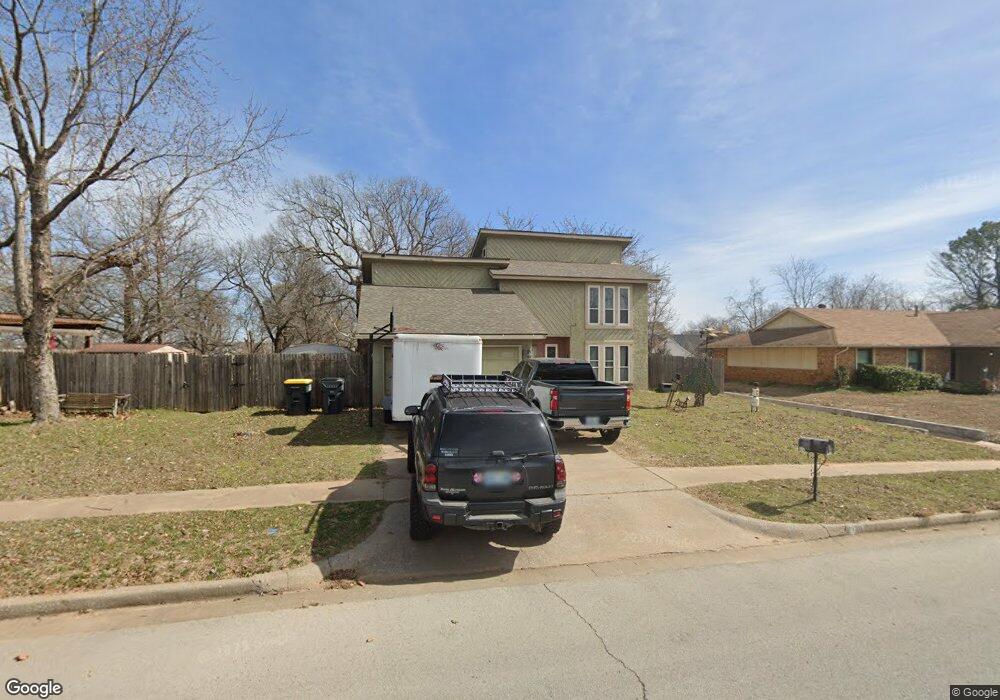
This home is located at 929 N Fir St, Jenks, OK 74037 and is currently estimated at $255,821, approximately $137 per square foot. 929 N Fir St is a home located in Tulsa County with nearby schools including Jenks West Elementary School, Jenks West Intermediate Elementary School, and Jenks Middle School.
Ownership History
Date
Name
Owned For
Owner Type
Purchase Details
Closed on
Nov 10, 2010
Sold by
Lee Vickie and Lee Vickie L
Bought by
Baker Kedrick
Current Estimated Value
Home Financials for this Owner
Home Financials are based on the most recent Mortgage that was taken out on this home.
Original Mortgage
$88,800
Outstanding Balance
$665
Interest Rate
4.23%
Mortgage Type
New Conventional
Estimated Equity
$255,156
Purchase Details
Closed on
May 1, 1992
Purchase Details
Closed on
Feb 1, 1992
Create a Home Valuation Report for This Property
The Home Valuation Report is an in-depth analysis detailing your home's value as well as a comparison with similar homes in the area
Home Values in the Area
Average Home Value in this Area
Purchase History
| Date | Buyer | Sale Price | Title Company |
|---|---|---|---|
| Baker Kedrick | $111,000 | Multiple | |
| -- | $70,000 | -- | |
| -- | $59,000 | -- |
Source: Public Records
Mortgage History
| Date | Status | Borrower | Loan Amount |
|---|---|---|---|
| Open | Baker Kedrick | $88,800 |
Source: Public Records
Tax History Compared to Growth
Tax History
| Year | Tax Paid | Tax Assessment Tax Assessment Total Assessment is a certain percentage of the fair market value that is determined by local assessors to be the total taxable value of land and additions on the property. | Land | Improvement |
|---|---|---|---|---|
| 2024 | $1,986 | $16,374 | $1,856 | $14,518 |
| 2023 | $1,986 | $15,595 | $1,952 | $13,643 |
| 2022 | $1,909 | $14,852 | $2,661 | $12,191 |
| 2021 | $1,842 | $14,144 | $2,534 | $11,610 |
| 2020 | $1,766 | $13,864 | $2,484 | $11,380 |
| 2019 | $1,693 | $13,204 | $2,366 | $10,838 |
| 2018 | $1,704 | $13,204 | $2,366 | $10,838 |
| 2017 | $1,628 | $12,821 | $2,297 | $10,524 |
| 2016 | $1,589 | $12,210 | $2,266 | $9,944 |
| 2015 | $1,619 | $12,210 | $2,266 | $9,944 |
| 2014 | $1,655 | $12,210 | $2,266 | $9,944 |
Source: Public Records
Map
Nearby Homes
- 927 W J St
- 1012 N Forest Place
- 533 N Forest St
- 422 N Forest St
- 149 W L St
- 108 W K Place
- 9340 S Elwood Ave
- 649 W 101st Place S
- 9402 S Elwood
- 2102 W J St
- 0 W 101st Place S
- 2102 W F Ct
- 2105 W F Ct
- 504 E B St Unit G
- 0 Aquarium Dr
- 9726 S Houston Ave
- 1 W 81st St
- 508 N Willow St
- 2428 W C St
- 13099 S Harvard