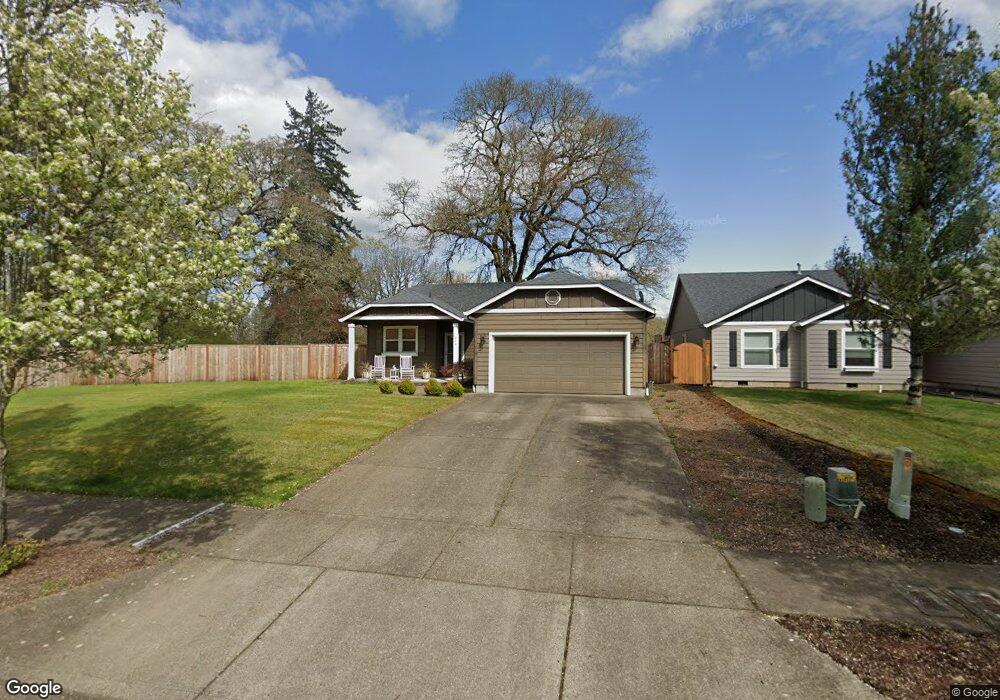
929 Oakmont Loop NE Albany, OR 97322
East Albany NeighborhoodEstimated Value: $436,463 - $455,000
3
Beds
2
Baths
1,380
Sq Ft
$323/Sq Ft
Est. Value
About This Home
This home is located at 929 Oakmont Loop NE, Albany, OR 97322 and is currently estimated at $445,732, approximately $322 per square foot. 929 Oakmont Loop NE is a home located in Linn County with nearby schools including Clover Ridge Elementary School, Timber Ridge School, and South Albany High School.
Ownership History
Date
Name
Owned For
Owner Type
Purchase Details
Closed on
Aug 25, 2020
Sold by
Pierson Derek and Pierson Danielle
Bought by
Mitchell Chloe Rae and Fields Patrik Korey
Current Estimated Value
Home Financials for this Owner
Home Financials are based on the most recent Mortgage that was taken out on this home.
Original Mortgage
$293,075
Outstanding Balance
$258,901
Interest Rate
2.9%
Mortgage Type
New Conventional
Estimated Equity
$186,831
Purchase Details
Closed on
Jul 19, 2016
Sold by
Clark Michael and Arnone Janel
Bought by
Pierson Derek and Pierson Danielle
Purchase Details
Closed on
Oct 11, 2010
Sold by
Hayden Homes Llc
Bought by
Clark Michael and Arnone Janel
Home Financials for this Owner
Home Financials are based on the most recent Mortgage that was taken out on this home.
Original Mortgage
$159,847
Interest Rate
4.37%
Mortgage Type
FHA
Create a Home Valuation Report for This Property
The Home Valuation Report is an in-depth analysis detailing your home's value as well as a comparison with similar homes in the area
Home Values in the Area
Average Home Value in this Area
Purchase History
| Date | Buyer | Sale Price | Title Company |
|---|---|---|---|
| Mitchell Chloe Rae | $308,500 | First American | |
| Pierson Derek | $214,900 | Ticor Title Company Of Or | |
| Clark Michael | $162,000 | Amerititle |
Source: Public Records
Mortgage History
| Date | Status | Borrower | Loan Amount |
|---|---|---|---|
| Open | Mitchell Chloe Rae | $293,075 | |
| Previous Owner | Clark Michael | $159,847 |
Source: Public Records
Tax History
| Year | Tax Paid | Tax Assessment Tax Assessment Total Assessment is a certain percentage of the fair market value that is determined by local assessors to be the total taxable value of land and additions on the property. | Land | Improvement |
|---|---|---|---|---|
| 2025 | $4,808 | $238,460 | -- | -- |
| 2024 | $4,661 | $231,520 | -- | -- |
| 2023 | $4,530 | $224,780 | $0 | $0 |
| 2022 | $4,465 | $218,240 | $0 | $0 |
| 2021 | $4,210 | $211,890 | $0 | $0 |
| 2020 | $4,161 | $205,720 | $0 | $0 |
| 2019 | $4,065 | $199,730 | $0 | $0 |
| 2018 | $3,957 | $193,920 | $0 | $0 |
| 2017 | $3,753 | $188,280 | $0 | $0 |
| 2016 | $3,372 | $182,800 | $0 | $0 |
Source: Public Records
Map
Nearby Homes
- 505 Montclair Dr NE
- 1780 Clover Ridge Rd NE
- 3915 Windy Ave NE
- 3711 Earl Ave NE
- 3705 Earl Ave NE
- 3482 Adah Ave NE
- 3550 Scott Ave NE
- 3448 Adah Ave NE
- 212 Breezy Way NE
- 3735 Knox Butte Rd E
- 300 Charlotte St NE
- 4129 Winners Circle Ave SE
- 216 Churchill Downs St SE
- 4145 Winners Circle Ave SE
- 391 Churchill Downs St SE
- 4227 Dogwood Ave SE
- 4301 Hackamore Ct SE
- 535 Withers Ct SE
- Ashland Plan at Brandis Estates
- 545 Withers Ct
- 929 Oakmont Loop NE
- 925 Oakmont Loop NE
- 925 Oakmont (Lot# 171) Lp NE
- 917 Oakmont (Lot# 170) Lp NE
- 917 Oakmont Loop NE Unit 170
- 917 Oakmont Loop NE
- 930 Oakmont Loop NE Unit 181
- 930 Oakmont Loop NE
- 922 Oakmont Loop NE
- 914 Oakmont Loop NE
- 3857 Oakmont Loop NE
- 903 Meadow Ct NE
- 881 Meadow Ct NE
- 3850 Oakmont Loop NE
- 899 Meadow Ct NE
- 898 Oakmont Loop NE
- 890 Oakmont Loop NE
- 3853 Oakmont Loop NE
- 3849 Oakmont Loop NE
- 927 Oakmont Loop NE
Your Personal Tour Guide
Ask me questions while you tour the home.