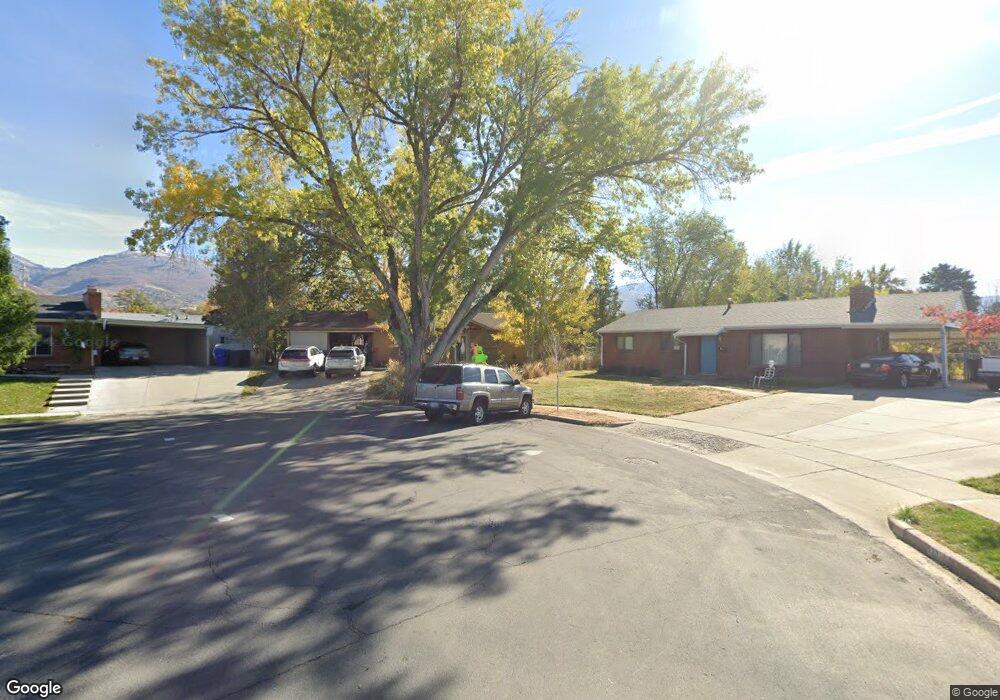
929 S 175 W Bountiful, UT 84010
Estimated Value: $475,241 - $546,000
3
Beds
2
Baths
1,161
Sq Ft
$432/Sq Ft
Est. Value
About This Home
This home is located at 929 S 175 W, Bountiful, UT 84010 and is currently estimated at $501,060, approximately $431 per square foot. 929 S 175 W is a home located in Davis County with nearby schools including Bountiful Elementary School, Millcreek Junior High School, and Bountiful High School.
Ownership History
Date
Name
Owned For
Owner Type
Purchase Details
Closed on
Jul 16, 2024
Sold by
Eastwind Construction Llc
Bought by
F O S Properties 3 Llc
Current Estimated Value
Purchase Details
Closed on
May 20, 2022
Sold by
Ohara Gay O
Bought by
Eastvvind Construction Iaa
Purchase Details
Closed on
Mar 28, 2022
Sold by
O Hara Jr John H
Bought by
Hara Gay O O
Create a Home Valuation Report for This Property
The Home Valuation Report is an in-depth analysis detailing your home's value as well as a comparison with similar homes in the area
Purchase History
| Date | Buyer | Sale Price | Title Company |
|---|---|---|---|
| F O S Properties 3 Llc | -- | Real Advantage Title | |
| Eastvvind Construction Iaa | -- | None Listed On Document | |
| Hara Gay O O | -- | None Listed On Document |
Source: Public Records
Tax History
| Year | Tax Paid | Tax Assessment Tax Assessment Total Assessment is a certain percentage of the fair market value that is determined by local assessors to be the total taxable value of land and additions on the property. | Land | Improvement |
|---|---|---|---|---|
| 2025 | $2,955 | $246,950 | $145,432 | $101,518 |
| 2024 | $2,713 | $238,699 | $131,941 | $106,758 |
| 2023 | $2,749 | $228,800 | $132,503 | $96,296 |
| 2022 | $2,457 | $226,600 | $131,063 | $95,537 |
| 2021 | $2,304 | $313,000 | $171,604 | $141,396 |
| 2020 | $2,206 | $275,000 | $145,803 | $129,197 |
| 2019 | $2,184 | $278,000 | $148,740 | $129,260 |
| 2018 | $1,861 | $252,000 | $145,683 | $106,317 |
| 2016 | $1,562 | $114,180 | $61,981 | $52,199 |
| 2015 | $1,622 | $104,115 | $61,981 | $42,134 |
| 2014 | $1,495 | $101,937 | $61,981 | $39,956 |
| 2013 | -- | $95,053 | $39,809 | $55,244 |
Source: Public Records
Map
Nearby Homes
Your Personal Tour Guide
Ask me questions while you tour the home.