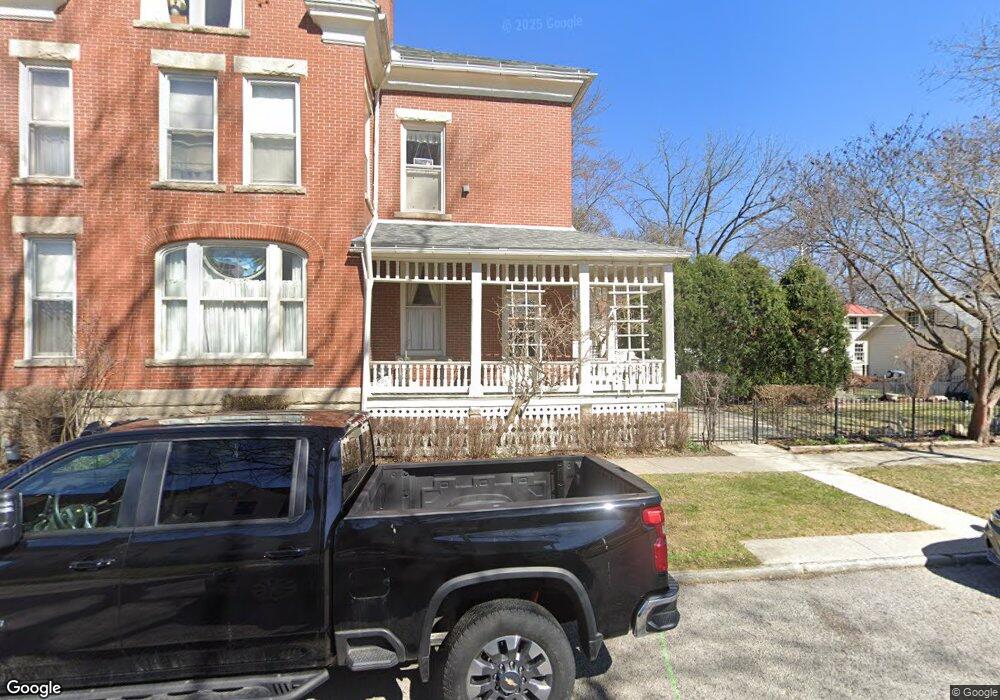
929 S Main St Findlay, OH 45840
Estimated Value: $314,000 - $376,000
5
Beds
4
Baths
3,936
Sq Ft
$86/Sq Ft
Est. Value
About This Home
This home is located at 929 S Main St, Findlay, OH 45840 and is currently estimated at $338,391, approximately $85 per square foot. 929 S Main St is a home located in Hancock County with nearby schools including Lincoln Elementary School, Donnell Middle School, and Findlay High School.
Ownership History
Date
Name
Owned For
Owner Type
Purchase Details
Closed on
Nov 14, 2012
Sold by
Hupman Aaron J
Bought by
Walles Robert A and Walles Laurie M
Current Estimated Value
Home Financials for this Owner
Home Financials are based on the most recent Mortgage that was taken out on this home.
Original Mortgage
$144,000
Outstanding Balance
$99,318
Interest Rate
3.35%
Mortgage Type
New Conventional
Estimated Equity
$239,073
Purchase Details
Closed on
Nov 9, 1990
Bought by
Hupman John N and Hupman Vaneda
Create a Home Valuation Report for This Property
The Home Valuation Report is an in-depth analysis detailing your home's value as well as a comparison with similar homes in the area
Home Values in the Area
Average Home Value in this Area
Purchase History
| Date | Buyer | Sale Price | Title Company |
|---|---|---|---|
| Walles Robert A | -- | Flag City Title Age4ncy | |
| Hupman John N | -- | -- |
Source: Public Records
Mortgage History
| Date | Status | Borrower | Loan Amount |
|---|---|---|---|
| Open | Walles Robert A | $144,000 |
Source: Public Records
Tax History
| Year | Tax Paid | Tax Assessment Tax Assessment Total Assessment is a certain percentage of the fair market value that is determined by local assessors to be the total taxable value of land and additions on the property. | Land | Improvement |
|---|---|---|---|---|
| 2024 | $3,110 | $87,540 | $5,240 | $82,300 |
| 2023 | $3,115 | $87,540 | $5,240 | $82,300 |
| 2022 | $3,104 | $87,540 | $5,240 | $82,300 |
| 2021 | $3,140 | $77,150 | $5,240 | $71,910 |
| 2020 | $3,140 | $77,150 | $5,240 | $71,910 |
| 2019 | $3,076 | $77,150 | $5,240 | $71,910 |
| 2018 | $2,763 | $63,540 | $3,490 | $60,050 |
| 2017 | $1,381 | $63,540 | $3,490 | $60,050 |
| 2016 | $2,719 | $63,540 | $3,490 | $60,050 |
| 2015 | $1,882 | $43,050 | $2,880 | $40,170 |
| 2014 | $1,883 | $43,050 | $2,880 | $40,170 |
| 2012 | $1,898 | $43,050 | $2,880 | $40,170 |
Source: Public Records
Map
Nearby Homes
- 865 S Main St
- 216 1st St
- 829 Maple Ave
- 123 Glendale Ave
- 206 Greenlawn Ave
- 412 Lima Ave
- 416 1/2 Lima Ave
- 1113 Hurd Ave
- 845 Hurd Ave
- 1304 Douglas Pkwy
- 860 Hurd Ave
- 324 W Mcpherson Ave
- 514 Liberty St
- 527 W Sandusky St
- 731 5th St
- 315 Fairlawn Place
- 331 Fairlawn Place
- 407 Washington St
- 15591 Canadian Way
- 15586 Canadian Way
Your Personal Tour Guide
Ask me questions while you tour the home.