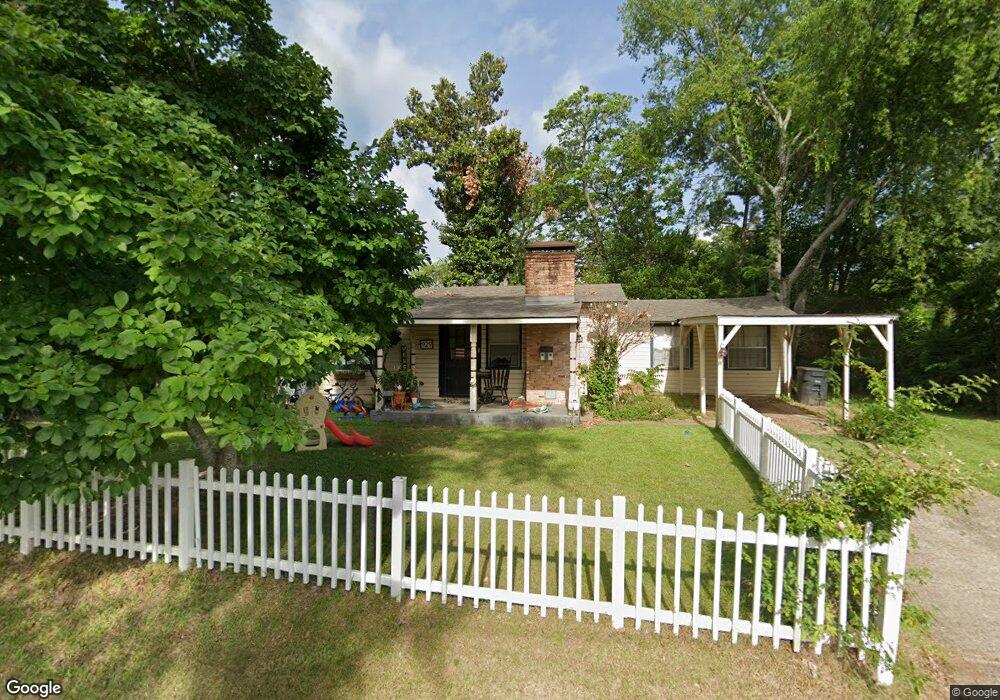
929 S Sneed Ave Tyler, TX 75701
Azalea District NeighborhoodEstimated Value: $198,718 - $286,000
3
Beds
2
Baths
1,132
Sq Ft
$196/Sq Ft
Est. Value
About This Home
This home is located at 929 S Sneed Ave, Tyler, TX 75701 and is currently estimated at $222,180, approximately $196 per square foot. 929 S Sneed Ave is a home located in Smith County with nearby schools including Bell Elementary School, Hogg Middle School, and Tyler Legacy High School.
Ownership History
Date
Name
Owned For
Owner Type
Purchase Details
Closed on
Apr 21, 2017
Sold by
Malone Amber N and Malone Chris D
Bought by
Wimberley Jacob Karl and Wimberley Alicia Jewel
Current Estimated Value
Home Financials for this Owner
Home Financials are based on the most recent Mortgage that was taken out on this home.
Original Mortgage
$95,733
Outstanding Balance
$79,563
Interest Rate
4.25%
Mortgage Type
FHA
Estimated Equity
$142,617
Purchase Details
Closed on
Sep 28, 2006
Sold by
Turner Carrie
Bought by
Malone Amber N and Malone Chris D
Home Financials for this Owner
Home Financials are based on the most recent Mortgage that was taken out on this home.
Original Mortgage
$69,200
Interest Rate
8.89%
Mortgage Type
Stand Alone First
Purchase Details
Closed on
Sep 26, 2005
Sold by
Browning Joretta Ray
Bought by
Turner Carrie Denise
Home Financials for this Owner
Home Financials are based on the most recent Mortgage that was taken out on this home.
Original Mortgage
$2,500
Interest Rate
5.76%
Mortgage Type
Seller Take Back
Create a Home Valuation Report for This Property
The Home Valuation Report is an in-depth analysis detailing your home's value as well as a comparison with similar homes in the area
Home Values in the Area
Average Home Value in this Area
Purchase History
| Date | Buyer | Sale Price | Title Company |
|---|---|---|---|
| Wimberley Jacob Karl | -- | None Available | |
| Malone Amber N | -- | Nationwide Title Clearing In | |
| Turner Carrie Denise | -- | None Available |
Source: Public Records
Mortgage History
| Date | Status | Borrower | Loan Amount |
|---|---|---|---|
| Open | Wimberley Jacob Karl | $95,733 | |
| Previous Owner | Malone Amber N | $69,200 | |
| Previous Owner | Turner Carrie Denise | $2,500 |
Source: Public Records
Tax History Compared to Growth
Tax History
| Year | Tax Paid | Tax Assessment Tax Assessment Total Assessment is a certain percentage of the fair market value that is determined by local assessors to be the total taxable value of land and additions on the property. | Land | Improvement |
|---|---|---|---|---|
| 2024 | $3,167 | $186,178 | $33,180 | $152,998 |
| 2023 | $3,000 | $172,076 | $33,180 | $138,896 |
| 2022 | $2,967 | $151,442 | $18,960 | $132,482 |
| 2021 | $2,483 | $118,365 | $18,960 | $99,405 |
| 2020 | $2,395 | $111,909 | $18,960 | $92,949 |
| 2019 | $2,179 | $99,628 | $18,960 | $80,668 |
| 2018 | $1,987 | $91,341 | $18,960 | $72,381 |
| 2017 | $2,013 | $94,275 | $18,960 | $75,315 |
| 2016 | $1,776 | $83,177 | $18,960 | $64,217 |
| 2015 | $1,413 | $80,645 | $18,960 | $61,685 |
| 2014 | $1,413 | $77,002 | $18,960 | $58,042 |
Source: Public Records
Map
Nearby Homes
- 520 E Lake St
- 300 E Dodge St
- 309 E Dodge St
- 517 E Wells St
- 735 S Donnybrook Ave
- 128 Rowland Place
- 124 Rowland Place
- 145 Rowland Place
- 114 E 2nd St
- 201 W Rusk St
- 310 W Dobbs St
- 1226 S Fleishel Ave
- 502 S Fannin Ave
- 400 Lindsey Ln
- 841 S Chilton Ave
- 815 S Chilton Ave
- 513 W 1st St
- 613 S Baxter Ave
- 1021 S Robertson Ave
- 325 W 4th St