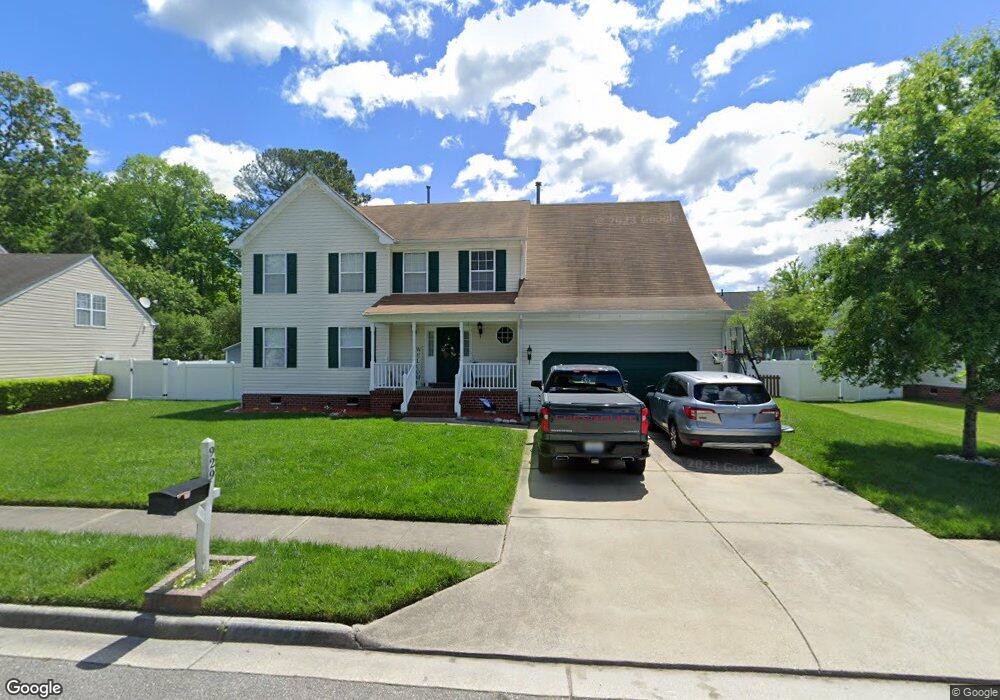
929 Speight Lyons Loop Chesapeake, VA 23322
Great Bridge NeighborhoodEstimated Value: $583,673 - $644,000
4
Beds
3
Baths
2,800
Sq Ft
$218/Sq Ft
Est. Value
About This Home
This home is located at 929 Speight Lyons Loop, Chesapeake, VA 23322 and is currently estimated at $611,418, approximately $218 per square foot. 929 Speight Lyons Loop is a home located in Chesapeake City with nearby schools including Cedar Road Elementary School, Hugo A. Owens Middle, and Grassfield High School.
Ownership History
Date
Name
Owned For
Owner Type
Purchase Details
Closed on
Aug 28, 2019
Sold by
Thompson Jonathan M
Bought by
Hallman John W and Hallman Jilliann M
Current Estimated Value
Home Financials for this Owner
Home Financials are based on the most recent Mortgage that was taken out on this home.
Original Mortgage
$332,910
Outstanding Balance
$292,199
Interest Rate
3.7%
Mortgage Type
New Conventional
Estimated Equity
$319,219
Purchase Details
Closed on
Apr 20, 2009
Sold by
Thompson Kristin L
Bought by
Thompson Jonathan M
Purchase Details
Closed on
Jan 31, 2005
Sold by
Brantley Robert
Bought by
Thompson Jonathan
Home Financials for this Owner
Home Financials are based on the most recent Mortgage that was taken out on this home.
Original Mortgage
$289,640
Interest Rate
5.64%
Mortgage Type
New Conventional
Purchase Details
Closed on
Apr 27, 2004
Sold by
Summit Const Corp
Bought by
Brantley Robert P
Home Financials for this Owner
Home Financials are based on the most recent Mortgage that was taken out on this home.
Original Mortgage
$254,500
Interest Rate
5.94%
Mortgage Type
New Conventional
Create a Home Valuation Report for This Property
The Home Valuation Report is an in-depth analysis detailing your home's value as well as a comparison with similar homes in the area
Home Values in the Area
Average Home Value in this Area
Purchase History
| Date | Buyer | Sale Price | Title Company |
|---|---|---|---|
| Hallman John W | $369,900 | Priority Title & Escrow Llc | |
| Thompson Jonathan M | -- | -- | |
| Thompson Jonathan | $362,500 | -- | |
| Brantley Robert P | $318,500 | -- |
Source: Public Records
Mortgage History
| Date | Status | Borrower | Loan Amount |
|---|---|---|---|
| Open | Hallman John W | $332,910 | |
| Previous Owner | Thompson Jonathan | $289,640 | |
| Previous Owner | Brantley Robert P | $254,500 |
Source: Public Records
Tax History
| Year | Tax Paid | Tax Assessment Tax Assessment Total Assessment is a certain percentage of the fair market value that is determined by local assessors to be the total taxable value of land and additions on the property. | Land | Improvement |
|---|---|---|---|---|
| 2025 | $4,845 | $521,200 | $160,000 | $361,200 |
| 2024 | $4,845 | $479,700 | $150,000 | $329,700 |
| 2023 | $4,292 | $471,500 | $140,000 | $331,500 |
| 2022 | $4,287 | $424,500 | $130,000 | $294,500 |
| 2021 | $3,830 | $364,800 | $120,000 | $244,800 |
| 2020 | $3,813 | $363,100 | $120,000 | $243,100 |
| 2019 | $3,848 | $366,500 | $120,000 | $246,500 |
| 2018 | $3,848 | $366,500 | $120,000 | $246,500 |
| 2017 | $3,583 | $341,200 | $120,000 | $221,200 |
| 2016 | $3,420 | $325,700 | $115,000 | $210,700 |
| 2015 | $3,249 | $309,400 | $105,000 | $204,400 |
| 2014 | $3,249 | $309,400 | $105,000 | $204,400 |
Source: Public Records
Map
Nearby Homes
- 1225 Bells Mill Rd
- Lot 5 Alexander Ln
- 321 Belle Ridge Ct
- 1041 Bells Mill Rd
- 924 Fox Ridge Trail
- 928 Fox Ridge Trail
- 900 Cedarwood Trace
- 948 Aberdeen Ln
- 808 Sagebrook Run Unit 89
- 716 River Strand
- 707 Whisper Walk
- 506 Whisper Walk
- 728 Luther St
- 905 Barcelona Ct
- 1427 Hawick Terrace
- 824 Heritage Point
- 460 San Roman Dr
- 1436 Scoonie Pointe Dr
- 1503 Mulligan Ct
- 404 Dundee Ln
- 933 Speight Lyons Loop
- 925 Speight Lyons Loop
- 987 Speight Lyons Loop
- 921 Speight Lyons Loop
- 927 New Mill Dr
- 935 Speight Lyons Loop
- 916 Speight Lyons Loop
- 925 New Mill Dr
- 929 New Mill Dr
- 983 Speight Lyons Loop
- 923 New Mill Dr
- 1001 New Mill Dr
- 917 Speight Lyons Loop
- 939 Speight Lyons Loop
- 938 Speight Lyons Loop
- 979 Speight Lyons Loop
- 926 New Mill Dr
- 921 New Mill Dr
- 912 Speight Lyons Loop
- 1181 Bells Mill Rd
Your Personal Tour Guide
Ask me questions while you tour the home.