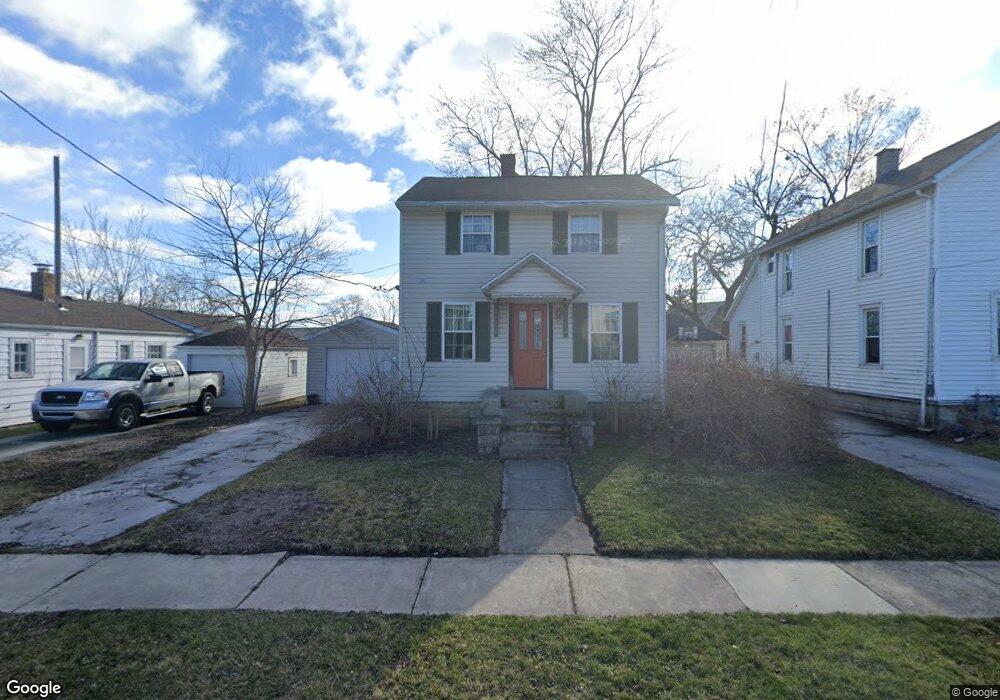
929 Summit St Findlay, OH 45840
Estimated Value: $125,000 - $136,000
Studio
1
Bath
988
Sq Ft
$132/Sq Ft
Est. Value
About This Home
This home is located at 929 Summit St, Findlay, OH 45840 and is currently estimated at $130,808, approximately $132 per square foot. 929 Summit St is a home located in Hancock County with nearby schools including Lincoln Elementary School, Donnell Middle School, and Findlay High School.
Ownership History
Date
Name
Owned For
Owner Type
Purchase Details
Closed on
Jul 31, 1996
Sold by
Balduf Dana
Bought by
Manny Eric
Current Estimated Value
Home Financials for this Owner
Home Financials are based on the most recent Mortgage that was taken out on this home.
Original Mortgage
$38,000
Outstanding Balance
$3,036
Interest Rate
8.33%
Mortgage Type
New Conventional
Estimated Equity
$127,772
Purchase Details
Closed on
Jul 17, 1995
Sold by
Loach Stephen
Bought by
Thomas Kenneth and Balduf Dana
Home Financials for this Owner
Home Financials are based on the most recent Mortgage that was taken out on this home.
Original Mortgage
$38,400
Interest Rate
7.79%
Mortgage Type
New Conventional
Create a Home Valuation Report for This Property
The Home Valuation Report is an in-depth analysis detailing your home's value as well as a comparison with similar homes in the area
Home Values in the Area
Average Home Value in this Area
Purchase History
| Date | Buyer | Sale Price | Title Company |
|---|---|---|---|
| Manny Eric | $65,900 | -- | |
| Thomas Kenneth | $33,000 | -- |
Source: Public Records
Mortgage History
| Date | Status | Borrower | Loan Amount |
|---|---|---|---|
| Open | Manny Eric | $38,000 | |
| Previous Owner | Thomas Kenneth | $38,400 |
Source: Public Records
Tax History
| Year | Tax Paid | Tax Assessment Tax Assessment Total Assessment is a certain percentage of the fair market value that is determined by local assessors to be the total taxable value of land and additions on the property. | Land | Improvement |
|---|---|---|---|---|
| 2024 | $1,015 | $28,570 | $3,200 | $25,370 |
| 2023 | $1,016 | $28,570 | $3,200 | $25,370 |
| 2022 | $1,013 | $28,570 | $3,200 | $25,370 |
| 2021 | $1,158 | $28,460 | $3,280 | $25,180 |
| 2020 | $1,158 | $28,460 | $3,280 | $25,180 |
| 2019 | $1,135 | $28,460 | $3,280 | $25,180 |
| 2018 | $990 | $22,770 | $2,630 | $20,140 |
| 2017 | $495 | $22,770 | $2,630 | $20,140 |
| 2016 | $986 | $22,770 | $2,630 | $20,140 |
| 2015 | $607 | $13,880 | $2,520 | $11,360 |
| 2014 | $607 | $13,880 | $2,520 | $11,360 |
| 2012 | $613 | $13,880 | $2,520 | $11,360 |
Source: Public Records
Map
Nearby Homes
Your Personal Tour Guide
Ask me questions while you tour the home.