929 SW 35th St Oklahoma City, OK 73109
Heronville NeighborhoodEstimated Value: $101,000 - $106,000
2
Beds
1
Bath
1,014
Sq Ft
$102/Sq Ft
Est. Value
About This Home
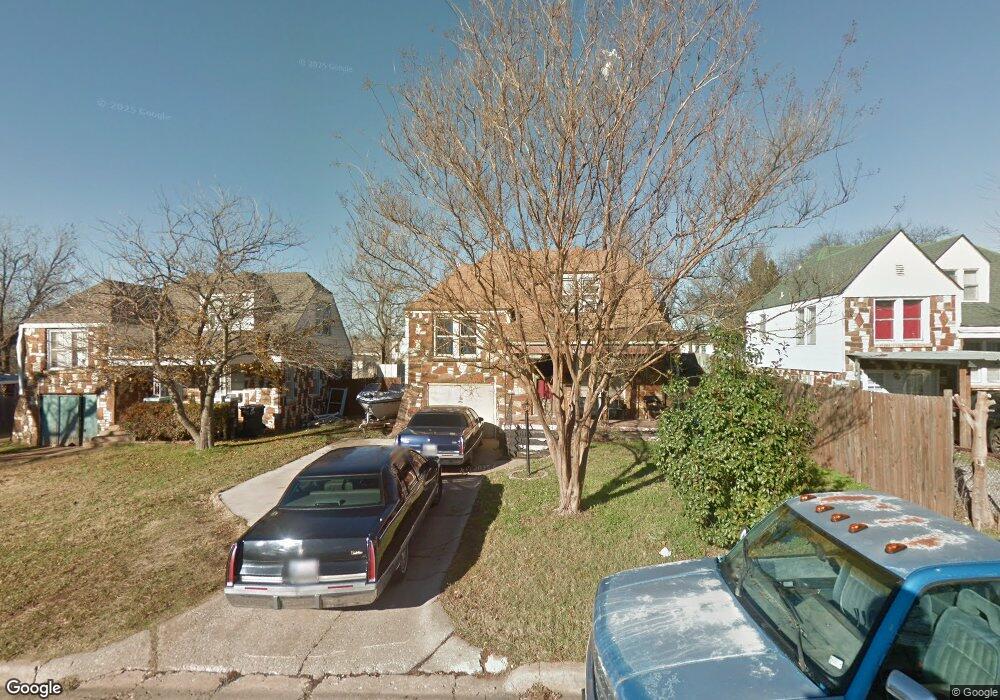
This home is located at 929 SW 35th St, Oklahoma City, OK 73109 and is currently estimated at $103,576, approximately $102 per square foot. 929 SW 35th St is a home located in Oklahoma County with nearby schools including Adelaide Lee Elementary School, Capitol Hill Middle School, and Capitol Hill High School.
Ownership History
Date
Name
Owned For
Owner Type
Purchase Details
Closed on
May 26, 2005
Sold by
Mull Properties Llc
Bought by
Toledo Hector A
Current Estimated Value
Home Financials for this Owner
Home Financials are based on the most recent Mortgage that was taken out on this home.
Original Mortgage
$53,675
Outstanding Balance
$28,220
Interest Rate
5.87%
Mortgage Type
FHA
Estimated Equity
$75,356
Purchase Details
Closed on
May 21, 2004
Sold by
Bradley Ervin C and Bradley Bonnie L
Bought by
Mull Properties Llc
Create a Home Valuation Report for This Property
The Home Valuation Report is an in-depth analysis detailing your home's value as well as a comparison with similar homes in the area
Home Values in the Area
Average Home Value in this Area
Purchase History
| Date | Buyer | Sale Price | Title Company |
|---|---|---|---|
| Toledo Hector A | $54,500 | American Guaranty Title Co | |
| Mull Properties Llc | $39,000 | American Guaranty Title Co |
Source: Public Records
Mortgage History
| Date | Status | Borrower | Loan Amount |
|---|---|---|---|
| Open | Toledo Hector A | $53,675 |
Source: Public Records
Tax History Compared to Growth
Tax History
| Year | Tax Paid | Tax Assessment Tax Assessment Total Assessment is a certain percentage of the fair market value that is determined by local assessors to be the total taxable value of land and additions on the property. | Land | Improvement |
|---|---|---|---|---|
| 2024 | $896 | $7,954 | $1,016 | $6,938 |
| 2023 | $896 | $7,575 | $1,040 | $6,535 |
| 2022 | $813 | $7,215 | $1,078 | $6,137 |
| 2021 | $772 | $6,872 | $989 | $5,883 |
| 2020 | $741 | $6,545 | $1,052 | $5,493 |
| 2019 | $717 | $6,352 | $1,030 | $5,322 |
| 2018 | $685 | $6,050 | $0 | $0 |
| 2017 | $684 | $6,049 | $1,023 | $5,026 |
| 2016 | $672 | $5,939 | $1,023 | $4,916 |
| 2015 | $694 | $6,076 | $1,023 | $5,053 |
| 2014 | $691 | $6,079 | $1,023 | $5,056 |
Source: Public Records
Map
Nearby Homes
- 1128 SW Grand Blvd
- 1033 SW Binkley St
- 3225 S Douglas Ave
- 1116 SW 38th St
- 1141 SW Binkley St
- 617 SW 35th St
- 325 SW 40th St
- 1028 SW 28th St
- 115 SW 28th St
- 607 SW 31st St
- 8 SW 41st St
- 1134 SW 42nd St
- 520 SW 31st St
- 4406 S Olie Ave
- 1044 SW 26th St
- 628 SW 43rd St
- 1432 Johnston Dr
- 505 SW 30th St
- 2708 S Mckinley Ave
- 4312 S Lee Ave